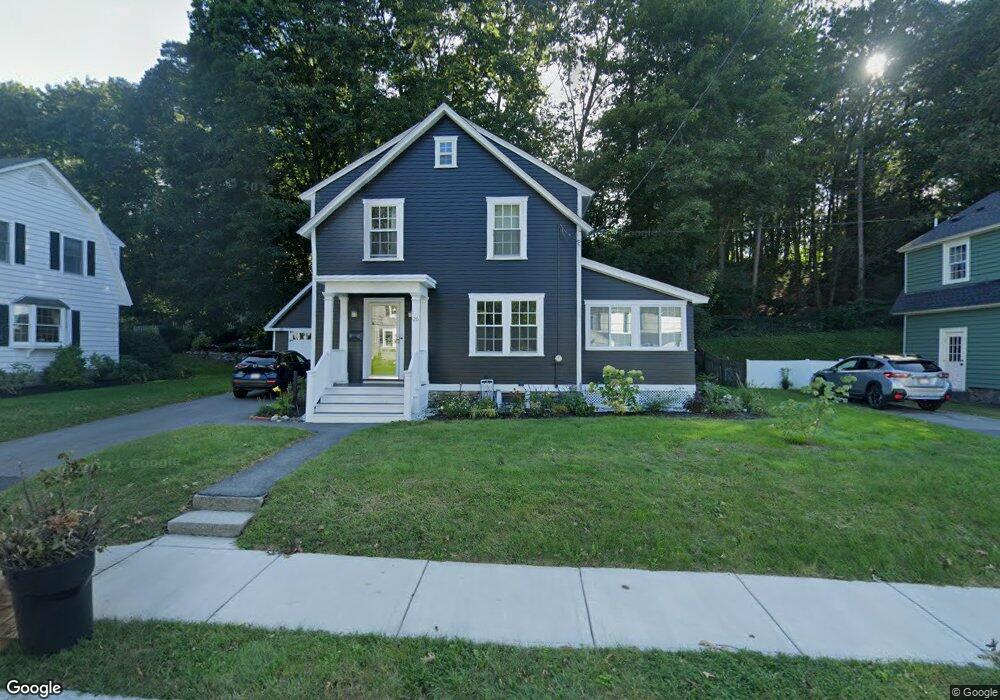
26 Enmore St Andover, MA 01810
Shawsheen Heights NeighborhoodEstimated Value: $657,000 - $813,000
3
Beds
1
Bath
1,152
Sq Ft
$617/Sq Ft
Est. Value
About This Home
This home is located at 26 Enmore St, Andover, MA 01810 and is currently estimated at $710,379, approximately $616 per square foot. 26 Enmore St is a home located in Essex County with nearby schools including West Elementary School, Andover West Middle School, and Andover High School.
Ownership History
Date
Name
Owned For
Owner Type
Purchase Details
Closed on
Apr 26, 2021
Sold by
Darfoor Samuel and Darfoor Jennifer
Bought by
Darfoor Ft and Darfoor
Current Estimated Value
Purchase Details
Closed on
Mar 1, 2001
Sold by
Mccool John R and Mccool Deborah K
Bought by
Darfoor Samuel and Darfoor Jennifer
Purchase Details
Closed on
Mar 31, 1997
Sold by
Hathaway Stephen D
Bought by
Mccool John R
Create a Home Valuation Report for This Property
The Home Valuation Report is an in-depth analysis detailing your home's value as well as a comparison with similar homes in the area
Home Values in the Area
Average Home Value in this Area
Purchase History
| Date | Buyer | Sale Price | Title Company |
|---|---|---|---|
| Darfoor Ft | -- | None Available | |
| Darfoor Ft | -- | None Available | |
| Darfoor Samuel | $287,500 | -- | |
| Darfoor Samuel | $287,500 | -- | |
| Mccool John R | $171,400 | -- | |
| Mccool John R | $171,400 | -- |
Source: Public Records
Mortgage History
| Date | Status | Borrower | Loan Amount |
|---|---|---|---|
| Previous Owner | Mccool John R | $262,402 | |
| Previous Owner | Mccool John R | $75,000 | |
| Previous Owner | Mccool John R | $100,000 |
Source: Public Records
Tax History Compared to Growth
Tax History
| Year | Tax Paid | Tax Assessment Tax Assessment Total Assessment is a certain percentage of the fair market value that is determined by local assessors to be the total taxable value of land and additions on the property. | Land | Improvement |
|---|---|---|---|---|
| 2024 | $9,003 | $699,000 | $465,500 | $233,500 |
| 2023 | $8,599 | $629,500 | $419,300 | $210,200 |
| 2022 | $8,217 | $562,800 | $371,100 | $191,700 |
| 2021 | $7,835 | $512,400 | $337,400 | $175,000 |
| 2020 | $7,507 | $500,100 | $329,100 | $171,000 |
| 2019 | $6,994 | $458,000 | $291,500 | $166,500 |
| 2018 | $6,689 | $427,700 | $275,000 | $152,700 |
| 2017 | $6,391 | $421,000 | $269,700 | $151,300 |
| 2016 | $5,980 | $403,500 | $252,200 | $151,300 |
| 2015 | $5,763 | $385,000 | $242,600 | $142,400 |
Source: Public Records
Map
Nearby Homes
- 156 High St
- 1 Longwood Dr Unit 105
- 20 Walnut Ave
- 170 Haverhill St Unit 138
- 6 Windsor St
- 2 Powder Mill Square Unit 2B
- 105 Elm St Unit A
- 42 Stevens St
- 88 Kingston St
- 32 Lucerne Dr
- 2 Kingston St Unit 2
- 156 Kingston St Unit 156
- Lot 7 Weeping Willow Dr
- 70 Farrwood Ave Unit 7
- 102 Weare St
- 75 Edgelawn Ave Unit 1
- 180 Chickering Rd Unit 310C
- 21 Clubview Dr Unit 21
- 124 Quail Run Rd
- 136 Quail Run Rd