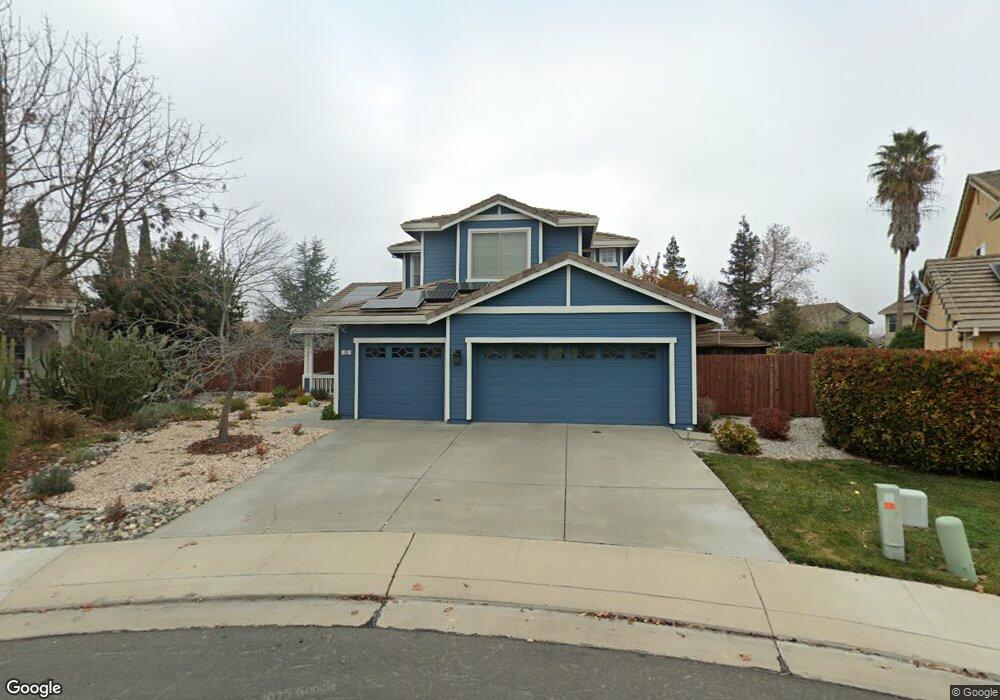
26 Epperson Ct Woodland, CA 95776
Estimated Value: $548,000 - $675,136
4
Beds
3
Baths
2,544
Sq Ft
$246/Sq Ft
Est. Value
About This Home
This home is located at 26 Epperson Ct, Woodland, CA 95776 and is currently estimated at $627,034, approximately $246 per square foot. 26 Epperson Ct is a home located in Yolo County with nearby schools including Ramon S. Tafoya Elementary School, Douglass Middle School, and Pioneer High School.
Ownership History
Date
Name
Owned For
Owner Type
Purchase Details
Closed on
Jan 27, 2022
Sold by
Thompson Corey A
Bought by
Thompson Family Trust
Current Estimated Value
Purchase Details
Closed on
Nov 24, 1998
Sold by
Morrison Homes A Div George Wimpey Inc
Bought by
Thompson Corey A and Thompson Renee B
Home Financials for this Owner
Home Financials are based on the most recent Mortgage that was taken out on this home.
Original Mortgage
$166,507
Interest Rate
6.69%
Create a Home Valuation Report for This Property
The Home Valuation Report is an in-depth analysis detailing your home's value as well as a comparison with similar homes in the area
Home Values in the Area
Average Home Value in this Area
Purchase History
| Date | Buyer | Sale Price | Title Company |
|---|---|---|---|
| Thompson Family Trust | -- | Reynolds Law Llp | |
| Thompson Corey A | $208,500 | First American Title |
Source: Public Records
Mortgage History
| Date | Status | Borrower | Loan Amount |
|---|---|---|---|
| Previous Owner | Thompson Corey A | $166,507 |
Source: Public Records
Tax History
| Year | Tax Paid | Tax Assessment Tax Assessment Total Assessment is a certain percentage of the fair market value that is determined by local assessors to be the total taxable value of land and additions on the property. | Land | Improvement |
|---|---|---|---|---|
| 2025 | $3,936 | $326,264 | $94,049 | $232,215 |
| 2023 | $3,936 | $313,597 | $90,398 | $223,199 |
| 2022 | $4,206 | $307,449 | $88,626 | $218,823 |
| 2021 | $4,155 | $301,422 | $86,889 | $214,533 |
| 2020 | $4,108 | $298,333 | $85,999 | $212,334 |
| 2019 | $4,038 | $292,484 | $84,313 | $208,171 |
| 2018 | $3,999 | $286,750 | $82,660 | $204,090 |
| 2017 | $3,924 | $281,129 | $81,040 | $200,089 |
| 2016 | $3,861 | $275,617 | $79,451 | $196,166 |
| 2015 | $3,757 | $271,478 | $78,258 | $193,220 |
| 2014 | $3,757 | $266,162 | $76,726 | $189,436 |
Source: Public Records
Map
Nearby Homes
- 1811 Mezger Dr
- 1880 Olvera Dr
- 1968 Hackett Dr
- 834 Atwell Cir
- 1060 Powers Cir
- 772 Laugenour Dr
- 2001 Baker Place
- 1501 Osborn Dr
- 2620 Farmers Central Rd
- 2078 Moses St
- 1435 Peterson Dr
- 2205 Armus St
- 1525 Griffith Dr
- 2355 Ortiz Ave
- 1625 Goode Place
- 2120 Freeway Dr
- 1909 Herrera Dr
- 1377 Elwood St
- 639 Matmor Rd
- 2108 Mcnary Place
Your Personal Tour Guide
Ask me questions while you tour the home.