Estimated Value: $2,146,000 - $2,751,000
2
Beds
4
Baths
755
Sq Ft
$3,211/Sq Ft
Est. Value
About This Home
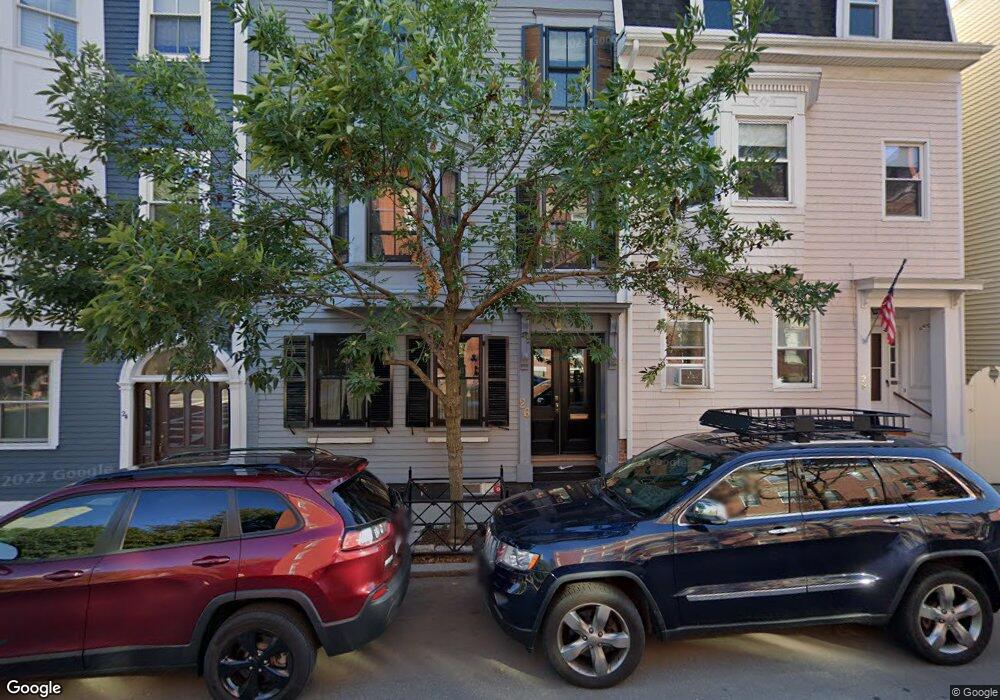
This home is located at 26 High St, Charlestown, MA 02129 and is currently estimated at $2,424,396, approximately $3,211 per square foot. 26 High St is a home located in Suffolk County with nearby schools including Boston Children's School and St John School.
Ownership History
Date
Name
Owned For
Owner Type
Purchase Details
Closed on
May 25, 2016
Sold by
Sweet Jonathan D
Bought by
Sweet Jonathan D and Hynes Johanna E
Current Estimated Value
Purchase Details
Closed on
Jan 26, 2007
Sold by
Card Aime and Card Wesley
Bought by
Sweet Jonathan D
Purchase Details
Closed on
Apr 19, 2002
Sold by
Warner Charles W and Warner Carol M
Bought by
Card Wesley and Card Aime
Purchase Details
Closed on
Dec 4, 1998
Sold by
Oates Adam R
Bought by
Warner Charles W and Warner Carol M
Purchase Details
Closed on
Jul 1, 1997
Sold by
Sennott Charles M and Sennott Julie A
Bought by
Oates Adam R
Purchase Details
Closed on
May 4, 1995
Sold by
Brady Edward J Est
Bought by
Sennott Charles M and Sennott Julie A
Create a Home Valuation Report for This Property
The Home Valuation Report is an in-depth analysis detailing your home's value as well as a comparison with similar homes in the area
Home Values in the Area
Average Home Value in this Area
Purchase History
| Date | Buyer | Sale Price | Title Company |
|---|---|---|---|
| Sweet Jonathan D | -- | -- | |
| Sweet Jonathan D | $921,000 | -- | |
| Card Wesley | $749,000 | -- | |
| Warner Charles W | $460,000 | -- | |
| Oates Adam R | $410,000 | -- | |
| Sennott Charles M | $216,000 | -- |
Source: Public Records
Mortgage History
| Date | Status | Borrower | Loan Amount |
|---|---|---|---|
| Previous Owner | Sennott Charles M | $510,000 | |
| Previous Owner | Sennott Charles M | $515,000 |
Source: Public Records
Property History
| Date | Event | Price | List to Sale | Price per Sq Ft |
|---|---|---|---|---|
| 08/31/2024 08/31/24 | For Rent | $4,395 | -- | -- |
Tax History Compared to Growth
Tax History
| Year | Tax Paid | Tax Assessment Tax Assessment Total Assessment is a certain percentage of the fair market value that is determined by local assessors to be the total taxable value of land and additions on the property. | Land | Improvement |
|---|---|---|---|---|
| 2025 | $21,628 | $1,867,700 | $659,500 | $1,208,200 |
| 2024 | $17,614 | $1,616,000 | $495,000 | $1,121,000 |
| 2023 | $16,071 | $1,496,400 | $458,400 | $1,038,000 |
| 2022 | $14,800 | $1,360,300 | $416,700 | $943,600 |
| 2021 | $14,514 | $1,360,300 | $416,700 | $943,600 |
| 2020 | $13,203 | $1,250,300 | $379,800 | $870,500 |
| 2019 | $12,924 | $1,226,200 | $304,600 | $921,600 |
| 2018 | $11,960 | $1,141,200 | $304,600 | $836,600 |
| 2017 | $12,010 | $1,134,100 | $304,600 | $829,500 |
| 2016 | $11,240 | $1,021,800 | $304,600 | $717,200 |
| 2015 | $10,984 | $907,000 | $265,400 | $641,600 |
| 2014 | $10,171 | $808,500 | $265,400 | $543,100 |
Source: Public Records
Map
Nearby Homes
- 46 High St
- 56 High St Unit 3
- 5 Wallace Ct
- 172 Bunker Hill St Unit 1
- 17 Henley St Unit F
- 17 Henley St Unit B
- 106 Bunker Hill St Unit 2
- 106 Bunker Hill St Unit 6
- 106 Bunker Hill St Unit 1
- 106 Bunker Hill St Unit 4P
- 106 Bunker Hill St Unit 3
- 12 Prospect St Unit 2
- 12 Prospect St Unit 1
- 207 Bunker Hill St Unit 2
- 73 Chelsea St Unit 401
- 22 Harvard St
- 1 Washington Place
- 9 Russell St Unit 2
- 9 Russell St Unit 1
- 247 Bunker Hill St Unit A
- 24 High St Unit 1
- 24 High St Unit 3
- 24 High St Unit 2
- 24 High St Unit 1
- 28 High St
- 28 High St Unit 2
- 60 Pleasant St
- 30 High St Unit 1
- 30 High St Unit 3
- 30 High St Unit 2
- 30 High St Unit 1
- 58 Pleasant St
- 37-38 Monument Square
- 37-38 Monument Square Unit 1
- 38 Monument Square Unit 1
- 39 Monument Square Unit 2
- 39 Monument Square Unit 1
- 37 Monument Square Unit 1
- 37 Monument Square
- 33 Cordis St