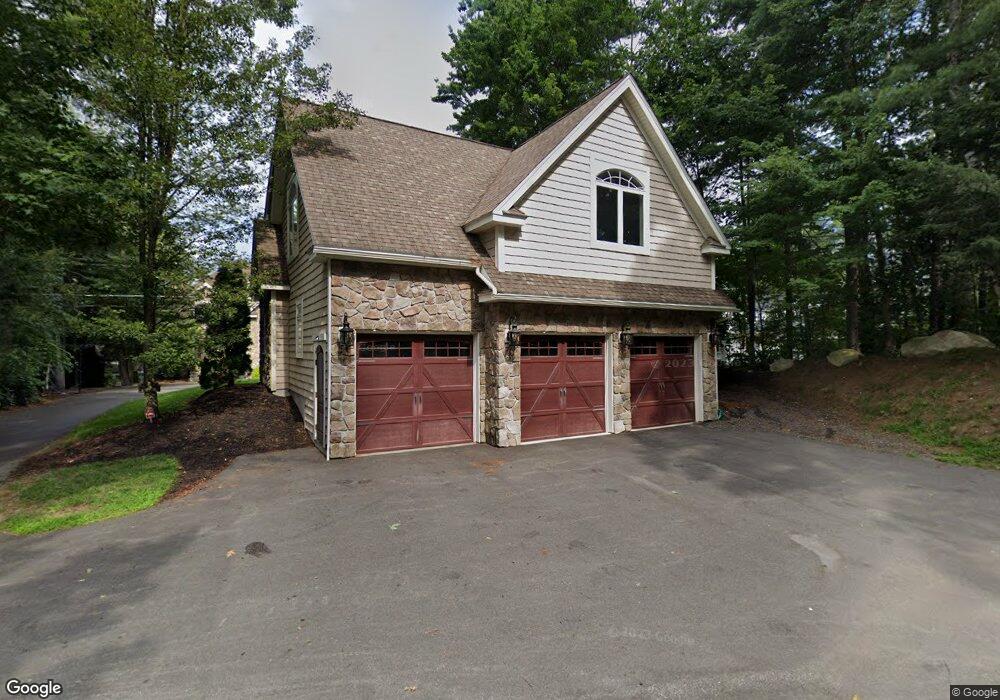
26 Horseshoe Rd Windham, NH 03087
Estimated Value: $991,356 - $1,531,000
4
Beds
3
Baths
2,674
Sq Ft
$442/Sq Ft
Est. Value
About This Home
This home is located at 26 Horseshoe Rd, Windham, NH 03087 and is currently estimated at $1,180,589, approximately $441 per square foot. 26 Horseshoe Rd is a home located in Rockingham County with nearby schools including Golden Brook Elementary School, Windham Middle School, and Windham High School.
Ownership History
Date
Name
Owned For
Owner Type
Purchase Details
Closed on
May 12, 2022
Sold by
Chapman Robert L and Chapman Susan J
Bought by
Chapman Ft
Current Estimated Value
Purchase Details
Closed on
Aug 31, 1995
Bought by
Chapman Robert L and Chapman Susan J
Create a Home Valuation Report for This Property
The Home Valuation Report is an in-depth analysis detailing your home's value as well as a comparison with similar homes in the area
Home Values in the Area
Average Home Value in this Area
Purchase History
| Date | Buyer | Sale Price | Title Company |
|---|---|---|---|
| Chapman Ft | -- | None Available | |
| Chapman Robert L | -- | -- |
Source: Public Records
Mortgage History
| Date | Status | Borrower | Loan Amount |
|---|---|---|---|
| Previous Owner | Chapman Robert L | $288,200 | |
| Previous Owner | Chapman Robert L | $750,000 | |
| Previous Owner | Chapman Robert L | $389,500 | |
| Previous Owner | Chapman Robert L | $414,050 |
Source: Public Records
Tax History Compared to Growth
Tax History
| Year | Tax Paid | Tax Assessment Tax Assessment Total Assessment is a certain percentage of the fair market value that is determined by local assessors to be the total taxable value of land and additions on the property. | Land | Improvement |
|---|---|---|---|---|
| 2024 | $18,112 | $800,000 | $594,000 | $206,000 |
| 2023 | $17,120 | $800,000 | $594,000 | $206,000 |
| 2022 | $15,808 | $800,000 | $594,000 | $206,000 |
| 2021 | $14,754 | $792,400 | $594,000 | $198,400 |
| 2020 | $15,159 | $792,400 | $594,000 | $198,400 |
| 2019 | $13,535 | $600,200 | $452,800 | $147,400 |
| 2018 | $11,776 | $600,200 | $452,800 | $147,400 |
| 2017 | $12,124 | $600,200 | $452,800 | $147,400 |
| 2016 | $13,096 | $600,200 | $452,800 | $147,400 |
| 2015 | $13,036 | $600,200 | $452,800 | $147,400 |
| 2014 | $14,287 | $595,300 | $445,000 | $150,300 |
| 2013 | $14,269 | $604,600 | $445,000 | $159,600 |
Source: Public Records
Map
Nearby Homes
- 10 1st St
- 6 Chadwick Cir
- 1 Squire Armour Rd
- 54 Enterprise Dr
- 15 Enterprise Dr
- 21 Lakeshore Rd
- 64 Stacey Cir
- 7 Camelot Rd
- 24 Rolling Ridge Rd
- 14 Woodland Rd
- 108 S Shore Rd
- 49 Hickory Ln
- 70 Governor Dinsmore Rd
- 219 Range Rd
- 1 Alpine Rd
- 133 Brookdale Rd
- 9 Cardinal Rd
- 95 Lake Shore Rd
- 7 Cardinal Rd
- 10 Roulston Rd