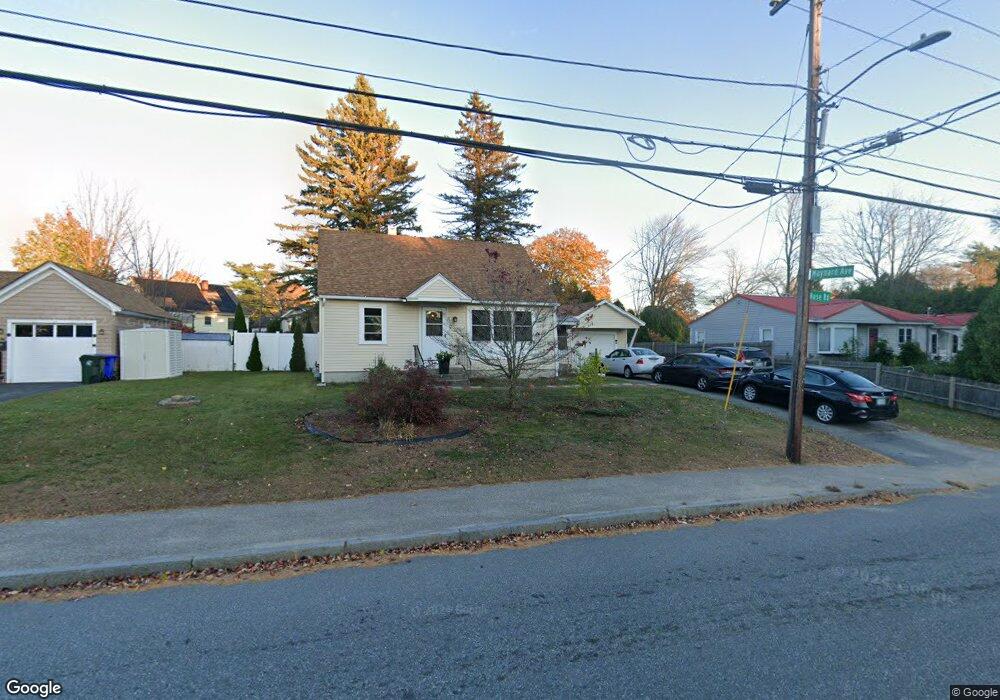
26 Huse Rd Manchester, NH 03103
Southside NeighborhoodEstimated Value: $417,372 - $530,000
3
Beds
2
Baths
1,092
Sq Ft
$419/Sq Ft
Est. Value
About This Home
This home is located at 26 Huse Rd, Manchester, NH 03103 and is currently estimated at $457,593, approximately $419 per square foot. 26 Huse Rd is a home located in Hillsborough County with nearby schools including Green Acres School, Henry J. McLaughlin Middle School, and Manchester Memorial High School.
Ownership History
Date
Name
Owned For
Owner Type
Purchase Details
Closed on
Nov 2, 2001
Sold by
Kennedy Patrick and Kennedy Dianne
Bought by
Caiazzo Paul S and Caiazzo Lisa M
Current Estimated Value
Home Financials for this Owner
Home Financials are based on the most recent Mortgage that was taken out on this home.
Original Mortgage
$160,038
Interest Rate
6.82%
Purchase Details
Closed on
Aug 6, 1999
Sold by
Anderson Kathleen Nye
Bought by
Mounce Tina M S and Mounce Dennis M
Home Financials for this Owner
Home Financials are based on the most recent Mortgage that was taken out on this home.
Original Mortgage
$109,444
Interest Rate
7.61%
Purchase Details
Closed on
Aug 2, 1999
Sold by
Oneill Michael B and Oneill Colleen S
Bought by
Kennedy Patrick and Kennedy Dianne
Home Financials for this Owner
Home Financials are based on the most recent Mortgage that was taken out on this home.
Original Mortgage
$109,444
Interest Rate
7.61%
Create a Home Valuation Report for This Property
The Home Valuation Report is an in-depth analysis detailing your home's value as well as a comparison with similar homes in the area
Home Values in the Area
Average Home Value in this Area
Purchase History
| Date | Buyer | Sale Price | Title Company |
|---|---|---|---|
| Caiazzo Paul S | $156,900 | -- | |
| Mounce Tina M S | $12,000 | -- | |
| Kennedy Patrick | $109,500 | -- |
Source: Public Records
Mortgage History
| Date | Status | Borrower | Loan Amount |
|---|---|---|---|
| Open | Kennedy Patrick | $203,707 | |
| Closed | Kennedy Patrick | $160,038 | |
| Previous Owner | Kennedy Patrick | $109,444 |
Source: Public Records
Tax History Compared to Growth
Tax History
| Year | Tax Paid | Tax Assessment Tax Assessment Total Assessment is a certain percentage of the fair market value that is determined by local assessors to be the total taxable value of land and additions on the property. | Land | Improvement |
|---|---|---|---|---|
| 2024 | $5,494 | $280,600 | $99,900 | $180,700 |
| 2023 | $5,292 | $280,600 | $99,900 | $180,700 |
| 2022 | $5,118 | $280,600 | $99,900 | $180,700 |
| 2021 | $4,961 | $280,600 | $99,900 | $180,700 |
| 2020 | $4,616 | $187,200 | $68,900 | $118,300 |
| 2019 | $4,553 | $187,200 | $68,900 | $118,300 |
| 2018 | $4,433 | $187,200 | $68,900 | $118,300 |
| 2017 | $4,366 | $187,200 | $68,900 | $118,300 |
| 2016 | $4,332 | $187,200 | $68,900 | $118,300 |
| 2015 | $4,268 | $182,100 | $63,800 | $118,300 |
| 2014 | $4,279 | $182,100 | $63,800 | $118,300 |
| 2013 | $4,128 | $182,100 | $63,800 | $118,300 |
Source: Public Records
Map
Nearby Homes