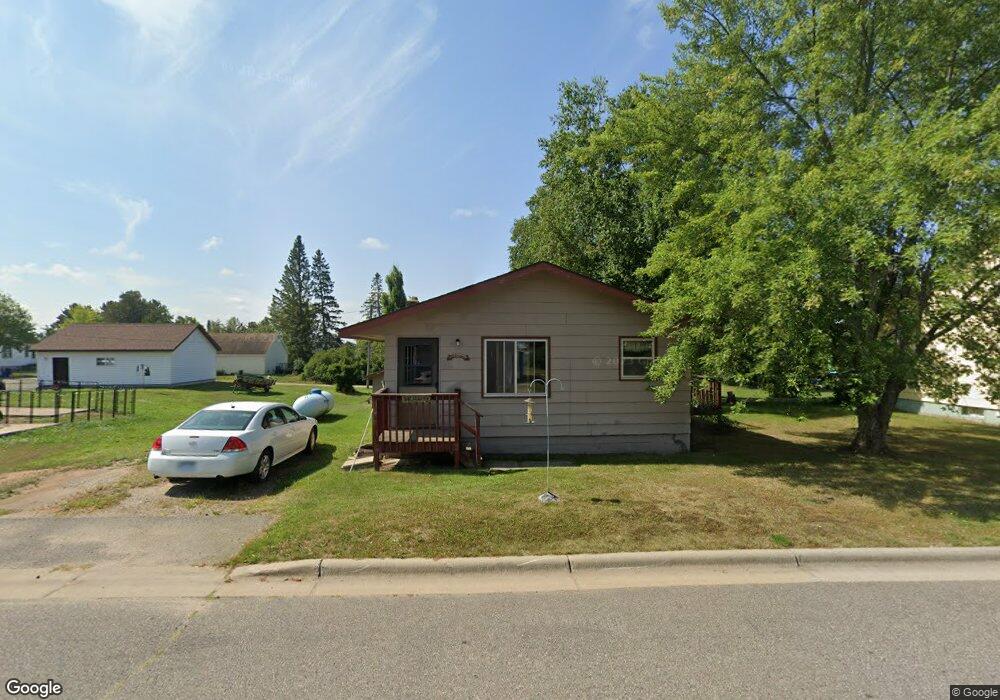
26 Jasper St Soudan, MN 55782
Soudan NeighborhoodEstimated Value: $149,824 - $167,000
3
Beds
2
Baths
1,152
Sq Ft
$138/Sq Ft
Est. Value
About This Home
This home is located at 26 Jasper St, Soudan, MN 55782 and is currently estimated at $158,456, approximately $137 per square foot. 26 Jasper St is a home with nearby schools including Tower-Soudan Elementary School and Vermilion Country School.
Ownership History
Date
Name
Owned For
Owner Type
Purchase Details
Closed on
Oct 6, 2016
Sold by
Lilya Jody
Bought by
Lilya John Charles
Current Estimated Value
Home Financials for this Owner
Home Financials are based on the most recent Mortgage that was taken out on this home.
Original Mortgage
$85,000
Interest Rate
3.44%
Mortgage Type
Closed End Mortgage
Purchase Details
Closed on
Jul 16, 2009
Sold by
Poderzay Julie
Bought by
Lilya John Charles
Home Financials for this Owner
Home Financials are based on the most recent Mortgage that was taken out on this home.
Original Mortgage
$48,450
Interest Rate
5.62%
Mortgage Type
Purchase Money Mortgage
Purchase Details
Closed on
Jul 2, 2009
Sold by
Lilya Gwenn Elizabeth
Bought by
Lilya Richard and Lilya Richard James
Home Financials for this Owner
Home Financials are based on the most recent Mortgage that was taken out on this home.
Original Mortgage
$48,450
Interest Rate
5.62%
Mortgage Type
Purchase Money Mortgage
Create a Home Valuation Report for This Property
The Home Valuation Report is an in-depth analysis detailing your home's value as well as a comparison with similar homes in the area
Home Values in the Area
Average Home Value in this Area
Purchase History
| Date | Buyer | Sale Price | Title Company |
|---|---|---|---|
| Lilya John Charles | -- | All American Title Co Inc | |
| Lilya John Charles | $60,000 | None Available | |
| Lilya Richard | -- | None Available |
Source: Public Records
Mortgage History
| Date | Status | Borrower | Loan Amount |
|---|---|---|---|
| Closed | Lilya John Charles | $85,000 | |
| Closed | Lilya John Charles | $48,450 |
Source: Public Records
Tax History
| Year | Tax Paid | Tax Assessment Tax Assessment Total Assessment is a certain percentage of the fair market value that is determined by local assessors to be the total taxable value of land and additions on the property. | Land | Improvement |
|---|---|---|---|---|
| 2024 | $422 | $108,300 | $8,300 | $100,000 |
| 2023 | $422 | $112,200 | $8,300 | $103,900 |
| 2022 | $642 | $93,400 | $7,900 | $85,500 |
| 2021 | $640 | $89,000 | $7,400 | $81,600 |
| 2020 | $712 | $89,000 | $7,400 | $81,600 |
| 2019 | $468 | $94,300 | $7,400 | $86,900 |
| 2018 | $358 | $80,900 | $7,000 | $73,900 |
| 2017 | $324 | $70,100 | $6,400 | $63,700 |
| 2016 | $328 | $66,800 | $6,000 | $60,800 |
| 2015 | $264 | $33,900 | $3,500 | $30,400 |
| 2014 | $264 | $35,700 | $3,500 | $32,200 |
Source: Public Records
Map
Nearby Homes
Your Personal Tour Guide
Ask me questions while you tour the home.