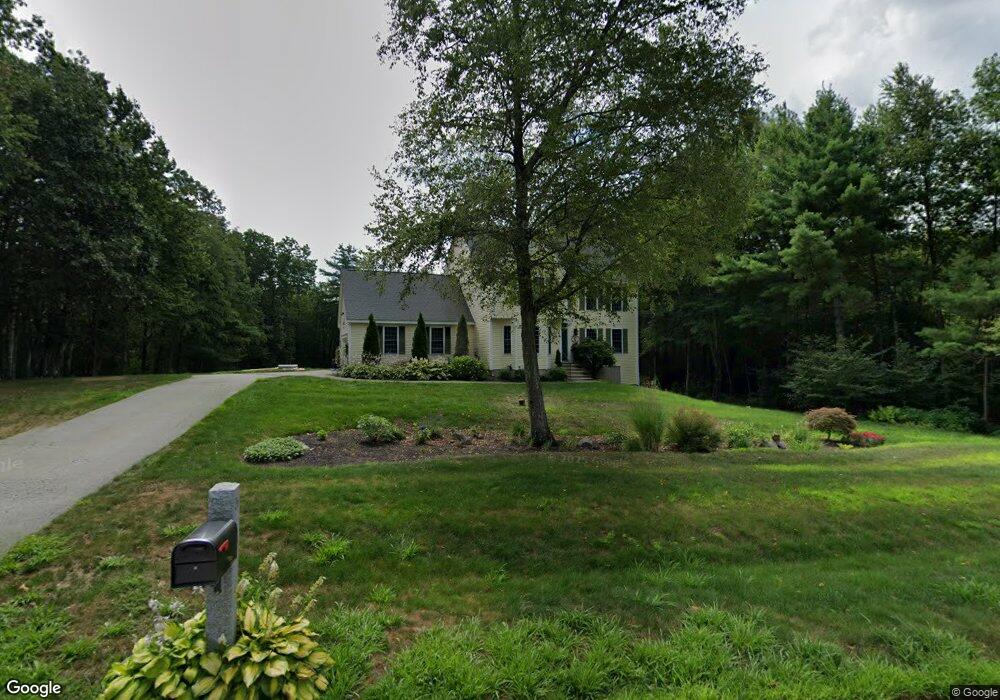
26 Kendrick Ln Milford, NH 03055
Estimated Value: $670,522 - $698,000
4
Beds
3
Baths
2,564
Sq Ft
$268/Sq Ft
Est. Value
About This Home
This home is located at 26 Kendrick Ln, Milford, NH 03055 and is currently estimated at $687,381, approximately $268 per square foot. 26 Kendrick Ln is a home located in Hillsborough County with nearby schools including Jacques Memorial Elementary School, Heron Pond Elementary School, and Milford Middle School.
Ownership History
Date
Name
Owned For
Owner Type
Purchase Details
Closed on
Aug 14, 2019
Sold by
Charles Christopher J and Charles Rochelle D
Bought by
Kriss Terrance and Kriss Mary
Current Estimated Value
Home Financials for this Owner
Home Financials are based on the most recent Mortgage that was taken out on this home.
Original Mortgage
$383,150
Outstanding Balance
$336,256
Interest Rate
3.8%
Mortgage Type
Purchase Money Mortgage
Estimated Equity
$351,125
Purchase Details
Closed on
Aug 27, 2004
Sold by
Ashwood Dev Co Inc
Bought by
Charles Christopher J and Charles Rochelle D
Home Financials for this Owner
Home Financials are based on the most recent Mortgage that was taken out on this home.
Original Mortgage
$296,000
Interest Rate
6.02%
Mortgage Type
Purchase Money Mortgage
Create a Home Valuation Report for This Property
The Home Valuation Report is an in-depth analysis detailing your home's value as well as a comparison with similar homes in the area
Home Values in the Area
Average Home Value in this Area
Purchase History
| Date | Buyer | Sale Price | Title Company |
|---|---|---|---|
| Kriss Terrance | $395,000 | -- | |
| Charles Christopher J | $370,000 | -- |
Source: Public Records
Mortgage History
| Date | Status | Borrower | Loan Amount |
|---|---|---|---|
| Open | Kriss Terrance | $383,150 | |
| Previous Owner | Charles Christopher J | $320,000 | |
| Previous Owner | Charles Christopher J | $45,000 | |
| Previous Owner | Charles Christopher J | $296,000 |
Source: Public Records
Tax History Compared to Growth
Tax History
| Year | Tax Paid | Tax Assessment Tax Assessment Total Assessment is a certain percentage of the fair market value that is determined by local assessors to be the total taxable value of land and additions on the property. | Land | Improvement |
|---|---|---|---|---|
| 2024 | $10,607 | $448,100 | $91,000 | $357,100 |
| 2023 | $9,934 | $448,100 | $91,000 | $357,100 |
| 2022 | $9,316 | $448,100 | $91,000 | $357,100 |
| 2021 | $9,029 | $448,100 | $91,000 | $357,100 |
| 2020 | $9,585 | $377,800 | $76,000 | $301,800 |
| 2019 | $9,811 | $377,800 | $76,000 | $301,800 |
| 2018 | $9,362 | $320,300 | $76,000 | $244,300 |
| 2017 | $9,414 | $320,300 | $76,000 | $244,300 |
| 2016 | $9,276 | $320,300 | $76,000 | $244,300 |
| 2015 | $9,088 | $318,200 | $76,000 | $242,200 |
| 2014 | $8,687 | $318,200 | $76,000 | $242,200 |
| 2013 | $8,582 | $318,200 | $76,000 | $242,200 |
Source: Public Records
Map
Nearby Homes
- 36 Berkeley Place
- 8 Carriage Ln
- 686 Route 13 S
- 16 Captain Danforth Ln
- 00 Ruonala Rd
- 77 Mooar Hill Rd
- 2 Ninth St
- 172 Hayden Rd
- 6 Veterans Rd Unit 15
- 303 Route 13
- 4-13 Woodmont Dr
- 8 Colburn Rd
- 26 Melendy Rd Unit 97
- 377 Nashua St
- 2 Benning St
- 44 Osgood Rd
- 12 Fairway Dr
- 0 Claude Rd
- 3 Wood Ln
- 102 Silver Lake Rd
- 22 Kendrick Ln
- 45 Kendrick Ln
- 25 Kendrick Ln
- 18 Kendrick Ln
- 11 Kendrick Ln
- 144 Wallingford Rd
- 12 Kendrick Ln
- 8 Kendrick Ln
- 137 Wallingford Rd
- 3 Kendrick Ln
- 150 Wallingford Rd
- 115 Wallingford Rd
- 121 Wallingford Rd
- 141 Wallingford Rd
- 149 Wallingford Rd
- 80 Wallingford Rd
- 127 Wallingford Rd
- 152 Wallingford Rd
- 91 Wallingford Rd
- 153 Wallingford Rd