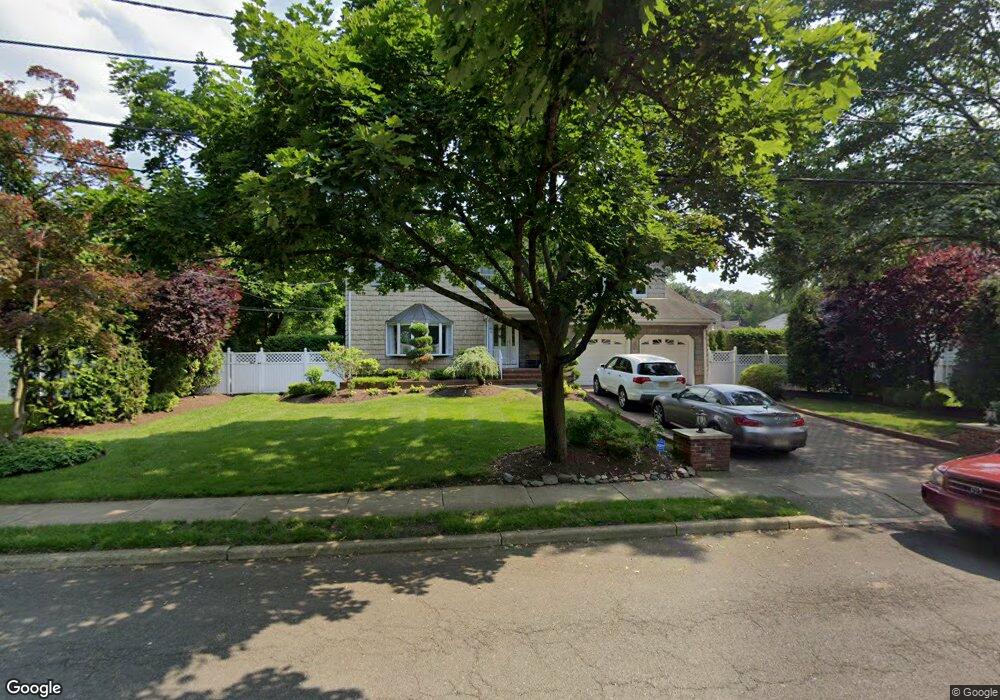
26 Pepperidge Rd Paramus, NJ 07652
Estimated Value: $1,215,000 - $1,459,000
Studio
--
Bath
3,030
Sq Ft
$437/Sq Ft
Est. Value
About This Home
This home is located at 26 Pepperidge Rd, Paramus, NJ 07652 and is currently estimated at $1,325,533, approximately $437 per square foot. 26 Pepperidge Rd is a home located in Bergen County with nearby schools including Paramus High School, David Gregory School, and Paramus Catholic High School.
Ownership History
Date
Name
Owned For
Owner Type
Purchase Details
Closed on
Dec 27, 2023
Sold by
Wolferman Jacalyn
Bought by
Jacalyn Wolferman Revocable Trust and Wolferman
Current Estimated Value
Purchase Details
Closed on
Aug 15, 2002
Sold by
Lettera Michael P
Bought by
Wolferman Stephen L and Wolferman Jacalyn
Home Financials for this Owner
Home Financials are based on the most recent Mortgage that was taken out on this home.
Original Mortgage
$200,000
Interest Rate
6.57%
Create a Home Valuation Report for This Property
The Home Valuation Report is an in-depth analysis detailing your home's value as well as a comparison with similar homes in the area
Home Values in the Area
Average Home Value in this Area
Purchase History
| Date | Buyer | Sale Price | Title Company |
|---|---|---|---|
| Jacalyn Wolferman Revocable Trust | -- | None Listed On Document | |
| Wolferman Stephen L | $670,000 | -- |
Source: Public Records
Mortgage History
| Date | Status | Borrower | Loan Amount |
|---|---|---|---|
| Previous Owner | Wolferman Stephen L | $200,000 |
Source: Public Records
Tax History
| Year | Tax Paid | Tax Assessment Tax Assessment Total Assessment is a certain percentage of the fair market value that is determined by local assessors to be the total taxable value of land and additions on the property. | Land | Improvement |
|---|---|---|---|---|
| 2025 | $13,500 | $978,600 | $446,100 | $532,500 |
| 2024 | $13,119 | $891,700 | $385,300 | $506,400 |
| 2023 | $12,445 | $855,200 | $367,400 | $487,800 |
| 2022 | $12,445 | $801,900 | $343,100 | $458,800 |
| 2021 | $12,142 | $734,100 | $312,400 | $421,700 |
| 2020 | $11,690 | $732,900 | $317,400 | $415,500 |
| 2019 | $13,358 | $719,700 | $313,500 | $406,200 |
| 2018 | $13,192 | $719,700 | $313,500 | $406,200 |
| 2017 | $12,962 | $719,700 | $313,500 | $406,200 |
| 2016 | $12,194 | $696,000 | $313,500 | $382,500 |
| 2015 | $12,069 | $696,000 | $313,500 | $382,500 |
| 2014 | $11,964 | $696,000 | $313,500 | $382,500 |
Source: Public Records
Map
Nearby Homes
- 84 W Midland Ave
- 11 Gabriel Ct
- 14 Gabriel Ct
- 19 Gabriel Ct
- 24 Gabriel Ct
- 16 Gabriel Ct
- 496 Cedar Ln
- 232 W Midland Ave
- 218 Mayfair Rd
- 461 Arthur Terrace
- 82 Azalea St
- 86 Azalea St
- 645 Cambridge Rd
- 495 Paramus Rd
- 648 Falmouth Ave
- 304 Blauvelt Ct
- 375 Burnet Place
- 229 Standish Rd
- 672 Rutgers Place
- 360 Valley View Ave
Your Personal Tour Guide
Ask me questions while you tour the home.