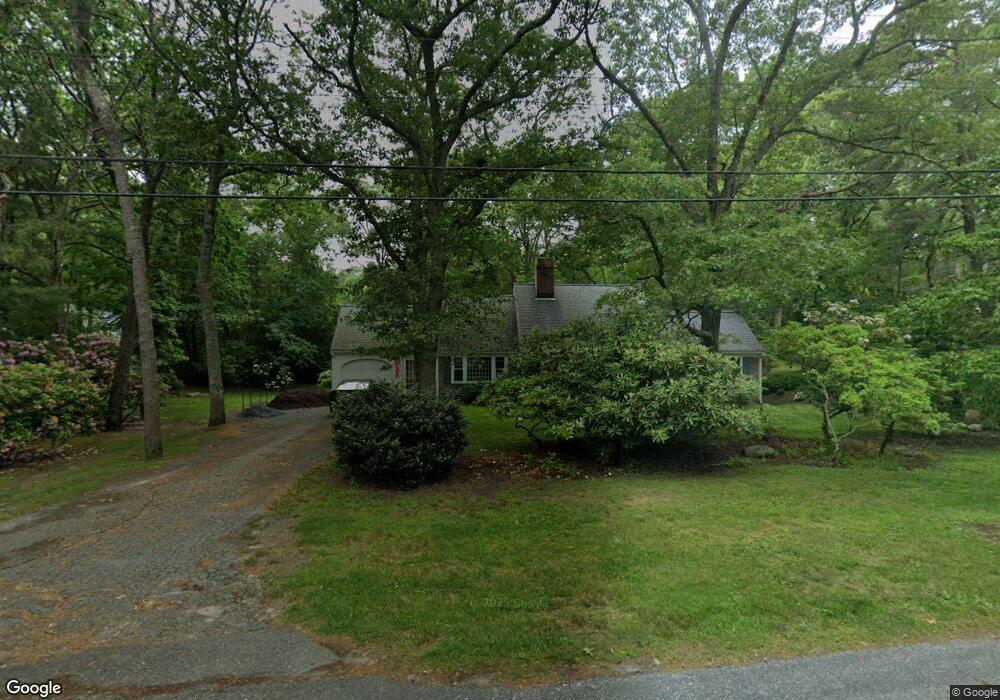
26 Pine St Sandwich, MA 02563
Estimated Value: $672,517 - $887,000
3
Beds
2
Baths
1,501
Sq Ft
$536/Sq Ft
Est. Value
About This Home
This home is located at 26 Pine St, Sandwich, MA 02563 and is currently estimated at $804,629, approximately $536 per square foot. 26 Pine St is a home located in Barnstable County with nearby schools including Sandwich Middle High School, Waldorf School of Cape Cod, and Bridgeview Montessori School.
Ownership History
Date
Name
Owned For
Owner Type
Purchase Details
Closed on
Apr 23, 2024
Sold by
Mclellan David R and Mclellan Constance E
Bought by
David R Mclellan Irt and Mclellan
Current Estimated Value
Purchase Details
Closed on
Apr 22, 2004
Sold by
Tyrer Nancy E
Bought by
Mobed Desiree E and Mobed Jeffrey N
Home Financials for this Owner
Home Financials are based on the most recent Mortgage that was taken out on this home.
Original Mortgage
$231,000
Interest Rate
5.4%
Mortgage Type
Purchase Money Mortgage
Purchase Details
Closed on
May 14, 1999
Sold by
Lord Priscilla M
Bought by
Tyrer Nancy E
Home Financials for this Owner
Home Financials are based on the most recent Mortgage that was taken out on this home.
Original Mortgage
$228,500
Interest Rate
6.92%
Mortgage Type
Purchase Money Mortgage
Create a Home Valuation Report for This Property
The Home Valuation Report is an in-depth analysis detailing your home's value as well as a comparison with similar homes in the area
Purchase History
| Date | Buyer | Sale Price | Title Company |
|---|---|---|---|
| David R Mclellan Irt | -- | None Available | |
| David R Mclellan Irt | -- | None Available | |
| Mobed Desiree E | $385,000 | -- | |
| Mobed Desiree E | $385,000 | -- | |
| Tyrer Nancy E | $199,900 | -- | |
| Tyrer Nancy E | $199,900 | -- |
Source: Public Records
Mortgage History
| Date | Status | Borrower | Loan Amount |
|---|---|---|---|
| Previous Owner | Tyrer Nancy E | $265,000 | |
| Previous Owner | Mobed Desiree E | $231,000 | |
| Previous Owner | Tyrer Nancy E | $228,500 |
Source: Public Records
Tax History
| Year | Tax Paid | Tax Assessment Tax Assessment Total Assessment is a certain percentage of the fair market value that is determined by local assessors to be the total taxable value of land and additions on the property. | Land | Improvement |
|---|---|---|---|---|
| 2025 | $5,985 | $566,200 | $204,200 | $362,000 |
| 2024 | $5,658 | $523,900 | $182,400 | $341,500 |
| 2023 | $5,480 | $476,500 | $165,800 | $310,700 |
| 2022 | $4,980 | $378,400 | $127,800 | $250,600 |
| 2021 | $4,763 | $345,900 | $122,900 | $223,000 |
| 2020 | $4,835 | $337,900 | $126,400 | $211,500 |
| 2019 | $0 | $328,600 | $130,300 | $198,300 |
| 2018 | $2,432 | $304,300 | $119,800 | $184,500 |
| 2017 | $0 | $305,700 | $133,300 | $172,400 |
| 2016 | $4,292 | $296,600 | $128,600 | $168,000 |
| 2015 | $4,206 | $283,800 | $118,900 | $164,900 |
Source: Public Records
Map
Nearby Homes
Your Personal Tour Guide
Ask me questions while you tour the home.