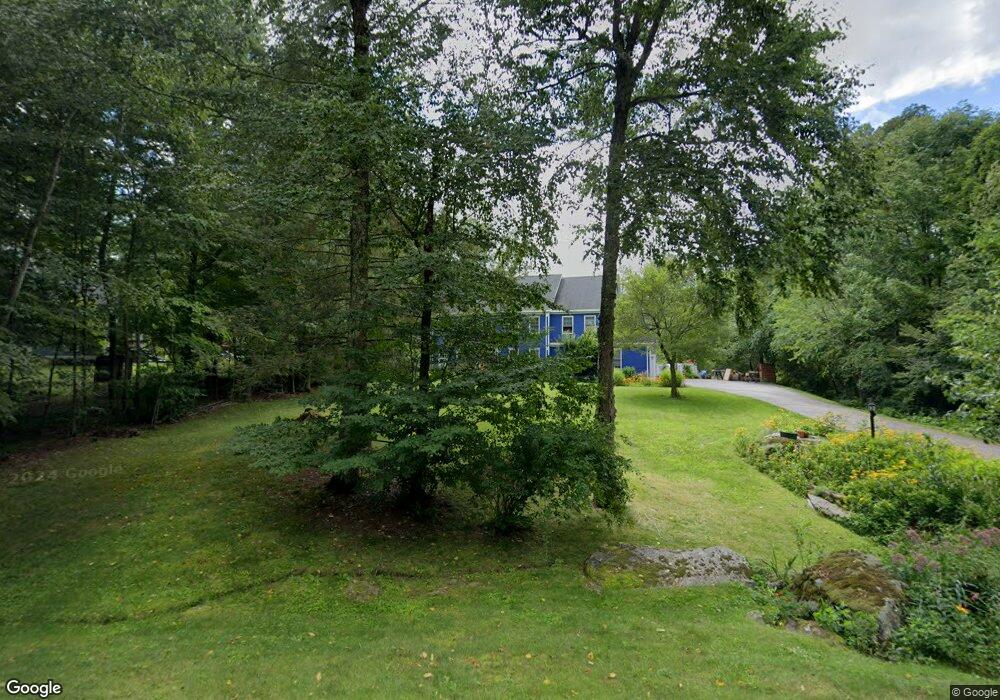
26 Ross Rd Durham, NH 03824
Estimated Value: $867,055 - $983,000
4
Beds
3
Baths
3,248
Sq Ft
$288/Sq Ft
Est. Value
About This Home
This home is located at 26 Ross Rd, Durham, NH 03824 and is currently estimated at $936,264, approximately $288 per square foot. 26 Ross Rd is a home located in Strafford County with nearby schools including Mast Way School, Oyster River Middle School, and Oyster River High School.
Ownership History
Date
Name
Owned For
Owner Type
Purchase Details
Closed on
Jul 29, 2003
Sold by
Landamerica Onestop In
Bought by
Raeder Joachim and Raeder Renate
Current Estimated Value
Home Financials for this Owner
Home Financials are based on the most recent Mortgage that was taken out on this home.
Original Mortgage
$225,000
Interest Rate
5.27%
Mortgage Type
Purchase Money Mortgage
Purchase Details
Closed on
Dec 14, 1998
Sold by
Kdc One Llc
Bought by
Main Russell P
Home Financials for this Owner
Home Financials are based on the most recent Mortgage that was taken out on this home.
Original Mortgage
$240,000
Interest Rate
6.8%
Mortgage Type
Purchase Money Mortgage
Create a Home Valuation Report for This Property
The Home Valuation Report is an in-depth analysis detailing your home's value as well as a comparison with similar homes in the area
Home Values in the Area
Average Home Value in this Area
Purchase History
| Date | Buyer | Sale Price | Title Company |
|---|---|---|---|
| Raeder Joachim | $450,000 | -- | |
| Landamerica Onestop In | $450,500 | -- | |
| Main Russell P | $58,500 | -- |
Source: Public Records
Mortgage History
| Date | Status | Borrower | Loan Amount |
|---|---|---|---|
| Open | Main Russell P | $172,000 | |
| Closed | Main Russell P | $225,000 | |
| Previous Owner | Main Russell P | $240,000 |
Source: Public Records
Tax History Compared to Growth
Tax History
| Year | Tax Paid | Tax Assessment Tax Assessment Total Assessment is a certain percentage of the fair market value that is determined by local assessors to be the total taxable value of land and additions on the property. | Land | Improvement |
|---|---|---|---|---|
| 2024 | $14,745 | $725,300 | $206,000 | $519,300 |
| 2023 | $14,854 | $725,300 | $206,000 | $519,300 |
| 2022 | $13,457 | $463,400 | $116,300 | $347,100 |
| 2021 | $12,933 | $463,400 | $116,300 | $347,100 |
| 2020 | $12,850 | $463,400 | $116,300 | $347,100 |
| 2019 | $12,711 | $463,400 | $116,300 | $347,100 |
| 2018 | $12,419 | $463,400 | $116,300 | $347,100 |
| 2017 | $13,019 | $424,900 | $105,500 | $319,400 |
| 2016 | $12,632 | $424,900 | $105,500 | $319,400 |
| 2015 | $12,683 | $424,900 | $105,500 | $319,400 |
| 2014 | $12,968 | $424,900 | $105,500 | $319,400 |
| 2013 | $12,921 | $424,900 | $105,500 | $319,400 |
Source: Public Records
Map
Nearby Homes
- 125 Main St Unit 39
- 2 Chapel St
- 30 Ffrost Dr
- 16 Railroad St
- 13 Moonlight Dr
- 23 Columbia Dr
- 90 Colgate Rd
- 85 Princeton St
- 2 Osprey Ln
- 23 Orchard Dr
- 16 Bennett Way
- 21 Briallia Cir
- 88 Durham Point Rd
- 31 Faculty Rd
- 24 Lilac Ln
- 4 Kelsey Dr
- 309 Packers Falls Rd
- 0 Pear Tree Ln Unit 9
- 0 Pear Tree Ln Unit 10
- 141 Hersey Ln