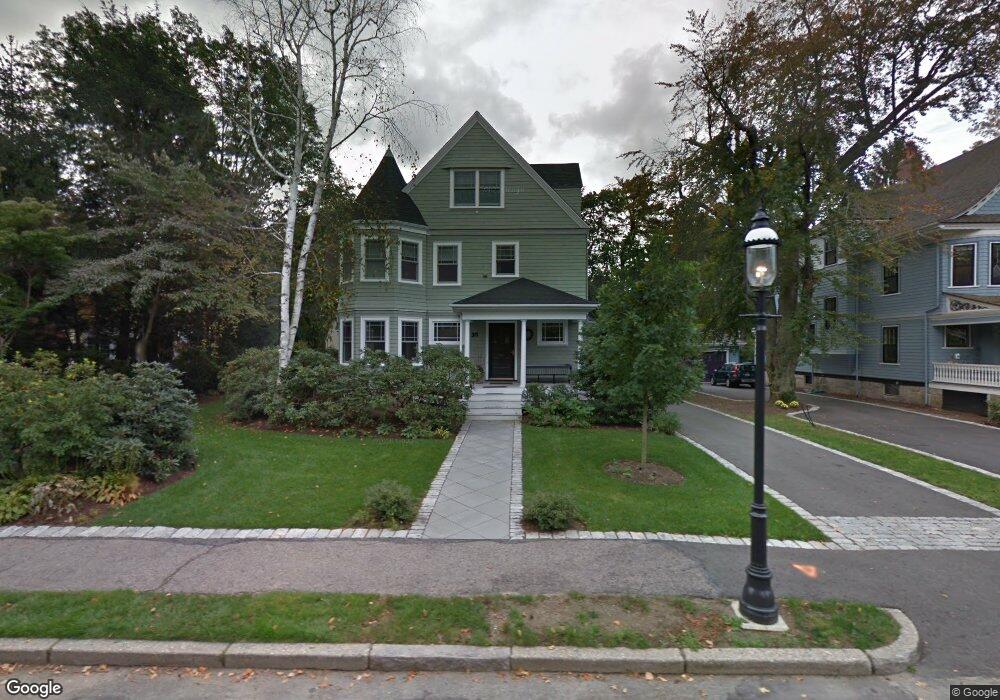
26 Sewall St West Newton, MA 02465
West Newton NeighborhoodEstimated Value: $3,244,052 - $3,868,000
5
Beds
5
Baths
3,734
Sq Ft
$966/Sq Ft
Est. Value
About This Home
This home is located at 26 Sewall St, West Newton, MA 02465 and is currently estimated at $3,607,513, approximately $966 per square foot. 26 Sewall St is a home located in Middlesex County with nearby schools including Peirce Elementary School, F.A. Day Middle School, and Newton North High School.
Ownership History
Date
Name
Owned For
Owner Type
Purchase Details
Closed on
Apr 27, 2004
Sold by
Boro Emily S and Boro Gilbert V
Bought by
Kendall Andrew W and Kendall Emilie K
Current Estimated Value
Home Financials for this Owner
Home Financials are based on the most recent Mortgage that was taken out on this home.
Original Mortgage
$580,000
Outstanding Balance
$265,930
Interest Rate
5.4%
Mortgage Type
Purchase Money Mortgage
Estimated Equity
$3,341,583
Create a Home Valuation Report for This Property
The Home Valuation Report is an in-depth analysis detailing your home's value as well as a comparison with similar homes in the area
Home Values in the Area
Average Home Value in this Area
Purchase History
| Date | Buyer | Sale Price | Title Company |
|---|---|---|---|
| Kendall Andrew W | $1,650,000 | -- |
Source: Public Records
Mortgage History
| Date | Status | Borrower | Loan Amount |
|---|---|---|---|
| Open | Kendall Andrew W | $580,000 |
Source: Public Records
Tax History Compared to Growth
Tax History
| Year | Tax Paid | Tax Assessment Tax Assessment Total Assessment is a certain percentage of the fair market value that is determined by local assessors to be the total taxable value of land and additions on the property. | Land | Improvement |
|---|---|---|---|---|
| 2025 | $33,636 | $3,432,200 | $1,386,900 | $2,045,300 |
| 2024 | $32,522 | $3,332,200 | $1,346,500 | $1,985,700 |
| 2023 | $31,521 | $3,096,400 | $1,059,400 | $2,037,000 |
| 2022 | $30,161 | $2,867,000 | $980,900 | $1,886,100 |
| 2021 | $8,389 | $2,704,700 | $925,400 | $1,779,300 |
| 2020 | $27,823 | $2,665,000 | $925,400 | $1,739,600 |
| 2019 | $27,038 | $2,587,400 | $898,400 | $1,689,000 |
| 2018 | $26,209 | $2,422,300 | $807,600 | $1,614,700 |
| 2017 | $25,411 | $2,285,200 | $761,900 | $1,523,300 |
| 2016 | $24,304 | $2,135,700 | $712,100 | $1,423,600 |
| 2015 | $23,174 | $1,996,000 | $665,500 | $1,330,500 |
Source: Public Records
Map
Nearby Homes
- 18 Sewall St
- 40 Sewall St
- 12 Inis Cir
- 10 Ruane Rd
- 39 Valentine Park
- 222 Prince St
- 1488 Washington St Unit 1488
- 318 Austin St Unit A
- 0 Duncan Rd Unit 72925240
- 308 Prince St
- 17 Gilbert St
- 51 Bourne St
- 1639 Washington St
- 371 Cherry St
- 36 Troy Ln
- 1230 Commonwealth Ave
- 10 Crescent St Unit 1
- 10 Crescent St Unit 2
- 27 Cross St Unit 27
- 17 Crescent St