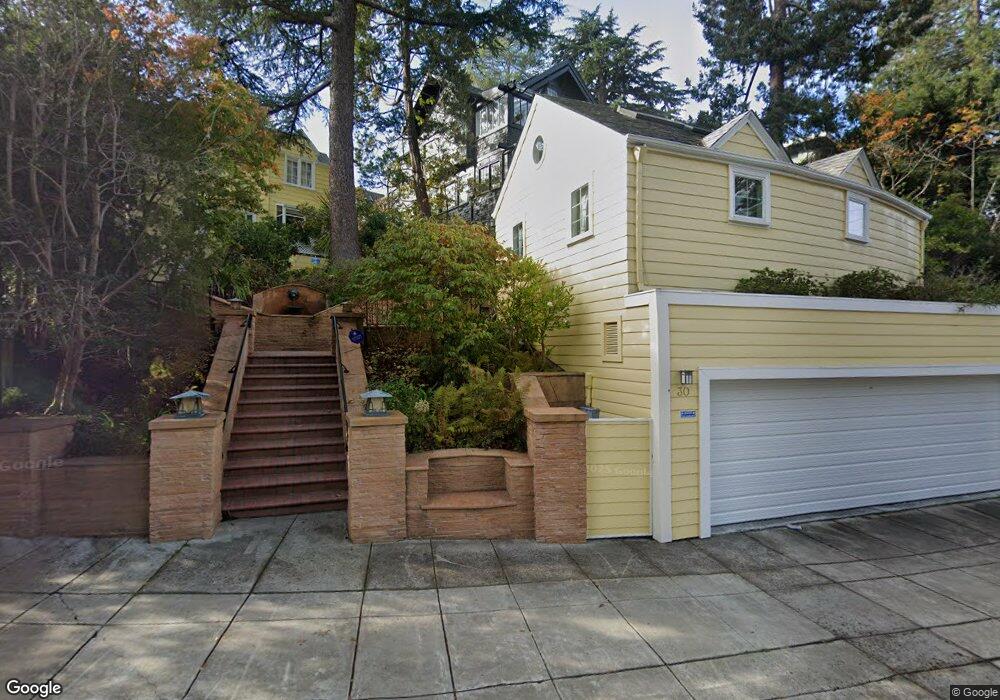
26 The Uplands Berkeley, CA 94705
Claremont NeighborhoodEstimated Value: $2,321,114 - $2,931,000
5
Beds
3
Baths
2,690
Sq Ft
$991/Sq Ft
Est. Value
About This Home
This home is located at 26 The Uplands, Berkeley, CA 94705 and is currently estimated at $2,664,779, approximately $990 per square foot. 26 The Uplands is a home located in Alameda County with nearby schools including John Muir Elementary School, Emerson Elementary School, and Malcolm X Elementary School.
Ownership History
Date
Name
Owned For
Owner Type
Purchase Details
Closed on
May 20, 2020
Sold by
Richards Jon Michael and Steinauer Jody
Bought by
Richards Jon Michael and Steinauer Jody
Current Estimated Value
Purchase Details
Closed on
Mar 11, 2008
Sold by
Johnston Janet N and The Janet N Johnston 2007 Revo
Bought by
Richards Michael and Steinauer Jody
Home Financials for this Owner
Home Financials are based on the most recent Mortgage that was taken out on this home.
Original Mortgage
$417,000
Outstanding Balance
$258,527
Interest Rate
5.65%
Mortgage Type
Purchase Money Mortgage
Estimated Equity
$2,406,252
Purchase Details
Closed on
Oct 18, 2007
Sold by
Johnston Janet Niven
Bought by
Revocabl Johnston Janet N and Revocabl Janet N Johnston 2007
Create a Home Valuation Report for This Property
The Home Valuation Report is an in-depth analysis detailing your home's value as well as a comparison with similar homes in the area
Home Values in the Area
Average Home Value in this Area
Purchase History
| Date | Buyer | Sale Price | Title Company |
|---|---|---|---|
| Richards Jon Michael | -- | None Available | |
| Richards Michael | $1,225,000 | Placer Title Company | |
| Revocabl Johnston Janet N | -- | None Available |
Source: Public Records
Mortgage History
| Date | Status | Borrower | Loan Amount |
|---|---|---|---|
| Open | Richards Michael | $417,000 |
Source: Public Records
Tax History
| Year | Tax Paid | Tax Assessment Tax Assessment Total Assessment is a certain percentage of the fair market value that is determined by local assessors to be the total taxable value of land and additions on the property. | Land | Improvement |
|---|---|---|---|---|
| 2025 | $24,526 | $1,601,951 | $482,685 | $1,126,266 |
| 2024 | $24,526 | $1,570,407 | $473,222 | $1,104,185 |
| 2023 | $24,017 | $1,546,488 | $463,946 | $1,082,542 |
| 2022 | $23,584 | $1,509,170 | $454,851 | $1,061,319 |
| 2021 | $23,644 | $1,479,451 | $445,935 | $1,040,516 |
| 2020 | $22,342 | $1,471,211 | $441,363 | $1,029,848 |
| 2019 | $21,435 | $1,442,375 | $432,712 | $1,009,663 |
| 2018 | $21,075 | $1,414,102 | $424,230 | $989,872 |
| 2017 | $20,373 | $1,386,381 | $415,914 | $970,467 |
| 2016 | $19,713 | $1,359,198 | $407,759 | $951,439 |
| 2015 | $19,448 | $1,338,790 | $401,637 | $937,153 |
| 2014 | $19,257 | $1,312,574 | $393,772 | $918,802 |
Source: Public Records
Map
Nearby Homes
- 2962 Piedmont Ave
- 204 El Camino Real
- 2477 Prince St
- 2817 Palm Ct
- 360 Alcatraz Ave
- 6100 Chabot Rd
- 6189 Margarido Dr
- 1488 Alvarado Rd
- 6446 Colby St
- 641 Alvarado Rd
- 2643 Stuart St
- 5936 Broadway
- 5941 Keith Ave
- 190 Stonewall Rd
- 0 Tunnel Rd
- 2935 Florence St
- 45 Vicente Rd
- 0 Gravatt Dr Unit 41122154
- 2632 Warring St Unit 3
- 2 Gravatt Dr
- 22 The Uplands
- 30 The Uplands
- 18 The Uplands
- 34 The Uplands
- 15 Hillcrest Ct
- 18 Hillcrest Ct
- 14 The Uplands
- 9 Hillcrest Ct
- 16 Hillcrest Ct
- 38 The Uplands
- 9 The Uplands
- 5 Hillcrest Ct
- 4 The Uplands
- 42 The Uplands
- 35 Parkside Dr
- 12 Hillcrest Ct
- 109 Hillcrest Rd
- 50 The Uplands
- 101 Hillcrest Rd
- 10 Encina Place
Your Personal Tour Guide
Ask me questions while you tour the home.