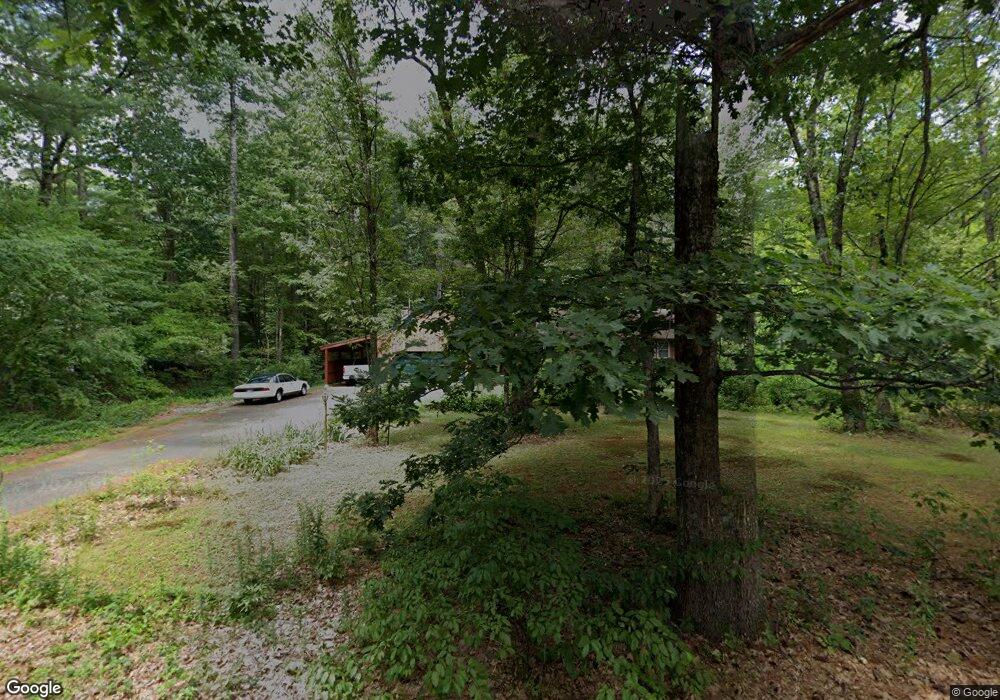
26 Truell Rd Hollis, NH 03049
Hollis NeighborhoodEstimated Value: $591,614 - $666,000
3
Beds
2
Baths
1,496
Sq Ft
$421/Sq Ft
Est. Value
About This Home
This home is located at 26 Truell Rd, Hollis, NH 03049 and is currently estimated at $630,404, approximately $421 per square foot. 26 Truell Rd is a home with nearby schools including Hollis Primary School, Hollis Upper Elementary School, and Hollis-Brookline Middle School.
Ownership History
Date
Name
Owned For
Owner Type
Purchase Details
Closed on
Jul 30, 2020
Sold by
Fotos Philip G and Fotos Janet E
Bought by
Pjf Ret
Current Estimated Value
Purchase Details
Closed on
Aug 2, 1999
Sold by
Parker David F and Parker Yueh-O Jane
Bought by
Fotos Phillip G and Fotos Janet E
Home Financials for this Owner
Home Financials are based on the most recent Mortgage that was taken out on this home.
Original Mortgage
$180,000
Interest Rate
7.61%
Create a Home Valuation Report for This Property
The Home Valuation Report is an in-depth analysis detailing your home's value as well as a comparison with similar homes in the area
Home Values in the Area
Average Home Value in this Area
Purchase History
| Date | Buyer | Sale Price | Title Company |
|---|---|---|---|
| Pjf Ret | -- | None Available | |
| Fotos Phillip G | $190,000 | -- |
Source: Public Records
Mortgage History
| Date | Status | Borrower | Loan Amount |
|---|---|---|---|
| Previous Owner | Fotos Phillip G | $180,000 |
Source: Public Records
Tax History Compared to Growth
Tax History
| Year | Tax Paid | Tax Assessment Tax Assessment Total Assessment is a certain percentage of the fair market value that is determined by local assessors to be the total taxable value of land and additions on the property. | Land | Improvement |
|---|---|---|---|---|
| 2024 | $9,539 | $538,000 | $294,200 | $243,800 |
| 2023 | $8,963 | $538,000 | $294,200 | $243,800 |
| 2022 | $12,143 | $538,000 | $294,200 | $243,800 |
| 2021 | $7,305 | $321,800 | $180,300 | $141,500 |
| 2020 | $7,459 | $321,800 | $180,300 | $141,500 |
| 2019 | $7,434 | $321,800 | $180,300 | $141,500 |
| 2018 | $6,973 | $321,800 | $180,300 | $141,500 |
| 2017 | $6,251 | $270,000 | $160,300 | $109,700 |
| 2016 | $6,326 | $270,000 | $160,300 | $109,700 |
| 2015 | $6,215 | $270,000 | $160,300 | $109,700 |
| 2014 | $6,245 | $270,000 | $160,300 | $109,700 |
| 2013 | $6,161 | $270,000 | $160,300 | $109,700 |
Source: Public Records
Map
Nearby Homes
- 77 Mooar Hill Rd
- 4-13 Woodmont Dr
- 172 Hayden Rd
- 102 Silver Lake Rd
- 3 Wood Ln
- 16 Captain Danforth Ln
- 25 Eastern Ave
- 6 Veterans Rd Unit 15
- 8 Carriage Ln
- 40-40A Pine Hill Rd
- 77 Broad St
- 36 Berkeley Place
- 118 Broad St
- 686 Route 13 S
- 2 Ninth St
- 199 Pine Hill Rd
- 303 Route 13
- 00 Ruonala Rd
- 8 Colburn Rd
- 12 Fairway Dr