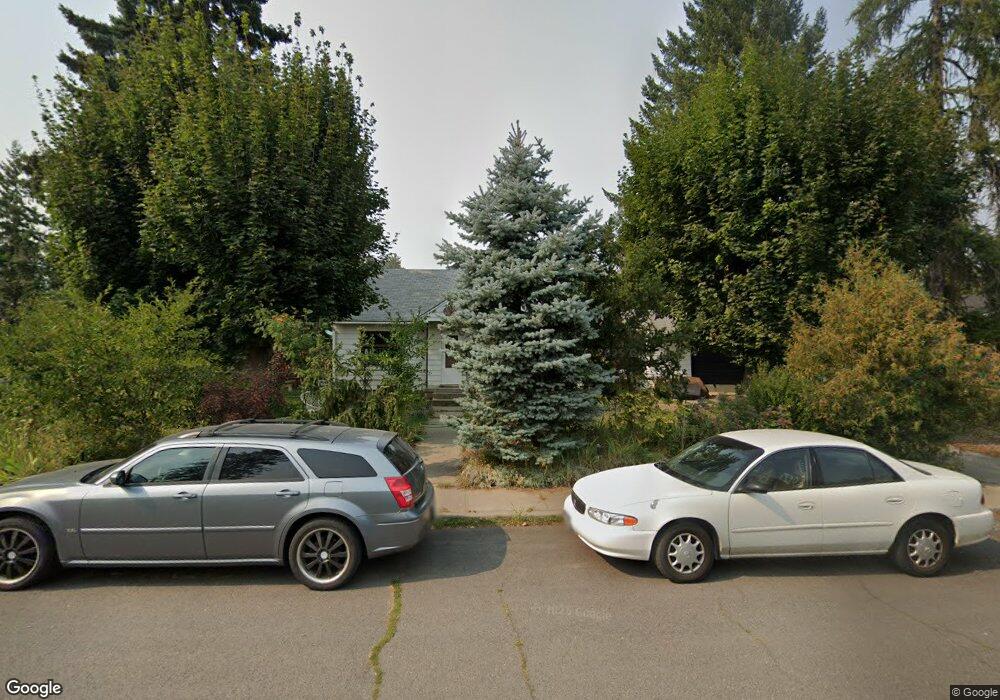
26 W 3rd St Cheney, WA 99004
Estimated Value: $254,000 - $332,000
2
Beds
1
Bath
1,445
Sq Ft
$200/Sq Ft
Est. Value
About This Home
This home is located at 26 W 3rd St, Cheney, WA 99004 and is currently estimated at $288,310, approximately $199 per square foot. 26 W 3rd St is a home located in Spokane County with nearby schools including Salnave Elementary School, Cheney Middle School, and Cheney High School.
Ownership History
Date
Name
Owned For
Owner Type
Purchase Details
Closed on
Feb 21, 2005
Sold by
Dukich Cynthia R
Bought by
French David C and Dukich Cynthia R
Current Estimated Value
Purchase Details
Closed on
Jun 2, 2004
Sold by
Vallance Carrie A
Bought by
Dukich Cynthia R
Home Financials for this Owner
Home Financials are based on the most recent Mortgage that was taken out on this home.
Original Mortgage
$84,000
Outstanding Balance
$41,035
Interest Rate
5.99%
Mortgage Type
Purchase Money Mortgage
Estimated Equity
$247,275
Purchase Details
Closed on
Jun 1, 2004
Sold by
French David
Bought by
Dukich Cynthia R
Home Financials for this Owner
Home Financials are based on the most recent Mortgage that was taken out on this home.
Original Mortgage
$84,000
Outstanding Balance
$41,035
Interest Rate
5.99%
Mortgage Type
Purchase Money Mortgage
Estimated Equity
$247,275
Purchase Details
Closed on
May 24, 1999
Sold by
Vallance Carrie A
Bought by
Vallance Carrie A and Kenneth E Mullenix Living Trust
Purchase Details
Closed on
Nov 21, 1995
Sold by
Mullenix Kenneth E
Bought by
Mullenix Kenneth E and Kenneth E Mullenix Living Trust
Create a Home Valuation Report for This Property
The Home Valuation Report is an in-depth analysis detailing your home's value as well as a comparison with similar homes in the area
Purchase History
| Date | Buyer | Sale Price | Title Company |
|---|---|---|---|
| French David C | -- | First American Title Ins | |
| Dukich Cynthia R | $105,000 | First American Title Ins | |
| Dukich Cynthia R | -- | First American Title Ins | |
| Vallance Carrie A | -- | -- | |
| Mullenix Kenneth E | -- | -- |
Source: Public Records
Mortgage History
| Date | Status | Borrower | Loan Amount |
|---|---|---|---|
| Open | Dukich Cynthia R | $84,000 | |
| Closed | Dukich Cynthia R | $15,750 |
Source: Public Records
Tax History
| Year | Tax Paid | Tax Assessment Tax Assessment Total Assessment is a certain percentage of the fair market value that is determined by local assessors to be the total taxable value of land and additions on the property. | Land | Improvement |
|---|---|---|---|---|
| 2025 | $2,436 | $235,200 | $75,000 | $160,200 |
| 2024 | $2,436 | $220,600 | $75,000 | $145,600 |
| 2023 | $1,998 | $225,600 | $80,000 | $145,600 |
| 2022 | $1,830 | $238,000 | $80,000 | $158,000 |
| 2021 | $1,819 | $158,700 | $42,000 | $116,700 |
| 2020 | $1,809 | $147,900 | $40,000 | $107,900 |
| 2019 | $1,565 | $134,700 | $40,000 | $94,700 |
| 2018 | $1,736 | $130,100 | $40,000 | $90,100 |
| 2017 | $1,505 | $124,600 | $40,000 | $84,600 |
| 2016 | $1,419 | $113,100 | $40,000 | $73,100 |
| 2015 | $1,375 | $111,500 | $40,000 | $71,500 |
| 2014 | -- | $111,500 | $40,000 | $71,500 |
| 2013 | -- | $0 | $0 | $0 |
Source: Public Records
Map
Nearby Homes
- 624 Union St
- 323 5th St
- XXX S Cheney Plaza Rd
- UNK S Cheney Plaza Rd Unit 12242.9010 & 12242.9
- UNK S Cheney Plaza Rd Unit 12242.9010
- UNK S Cheney Plaza Rd Unit 12242.9013
- 422 4th St
- 84 Terra Vista St Unit Lot 1
- 84-108 Terra Vista St Unit Lots 1-4, 6 & 7
- 317 College Ave
- 417 C St
- 2406 Anne Place
- 2402 Anne Place
- 2414 Anne Place
- 821 3rd St
- 910 2nd St
- 840 W 1st St Unit 29
- 840 W 1st St Unit 19
- 840 W 1st St Unit 10
- 840 W 1st St Unit 27
Your Personal Tour Guide
Ask me questions while you tour the home.