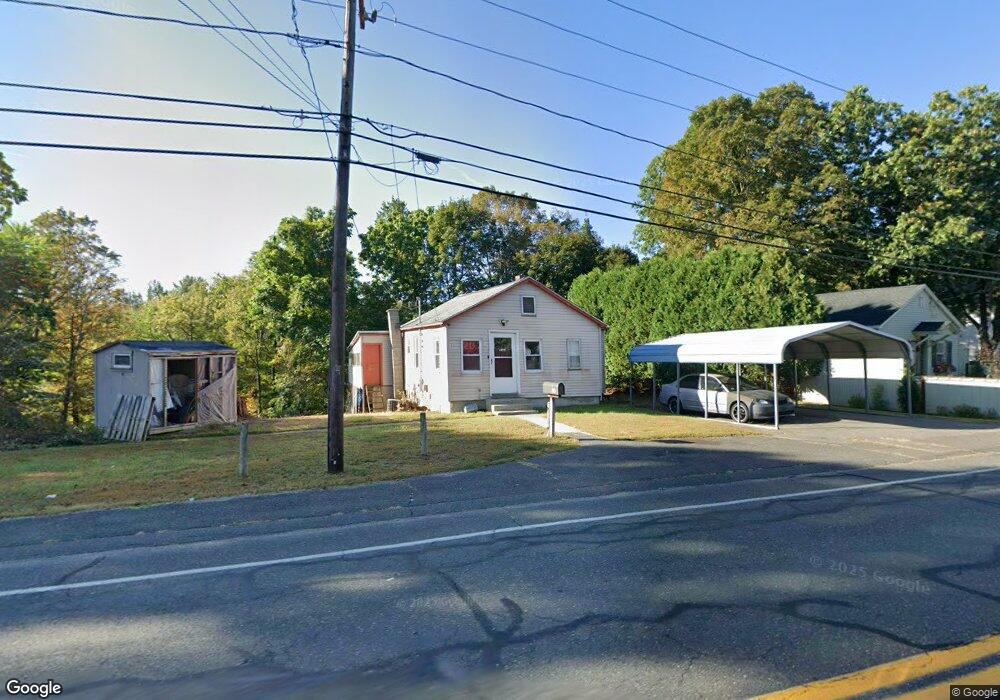
26 West St Easthampton, MA 01027
Estimated Value: $309,000 - $407,000
2
Beds
2
Baths
1,267
Sq Ft
$277/Sq Ft
Est. Value
About This Home
This home is located at 26 West St, Easthampton, MA 01027 and is currently estimated at $351,088, approximately $277 per square foot. 26 West St is a home located in Hampshire County with nearby schools including Easthampton High School, Hilltown Cooperative Charter Public School, and Calvary Baptist Christian School.
Ownership History
Date
Name
Owned For
Owner Type
Purchase Details
Closed on
Dec 12, 2008
Sold by
Maclure Anna R and Picard Anna R
Bought by
Picard Anna R and Picard Christopher J
Current Estimated Value
Home Financials for this Owner
Home Financials are based on the most recent Mortgage that was taken out on this home.
Original Mortgage
$169,046
Outstanding Balance
$113,643
Interest Rate
6.49%
Mortgage Type
FHA
Estimated Equity
$237,445
Purchase Details
Closed on
Oct 10, 2007
Sold by
Guerin Leward G
Bought by
Maclure Anna R and Picard Christopher J
Home Financials for this Owner
Home Financials are based on the most recent Mortgage that was taken out on this home.
Original Mortgage
$167,373
Interest Rate
6.49%
Mortgage Type
Purchase Money Mortgage
Purchase Details
Closed on
Mar 16, 2006
Sold by
Guerin Leward G
Bought by
Palata Debra J and Kauffman Loralee M
Create a Home Valuation Report for This Property
The Home Valuation Report is an in-depth analysis detailing your home's value as well as a comparison with similar homes in the area
Home Values in the Area
Average Home Value in this Area
Purchase History
| Date | Buyer | Sale Price | Title Company |
|---|---|---|---|
| Picard Anna R | -- | -- | |
| Maclure Anna R | $170,000 | -- | |
| Guerin Leward G | -- | -- | |
| Palata Debra J | -- | -- |
Source: Public Records
Mortgage History
| Date | Status | Borrower | Loan Amount |
|---|---|---|---|
| Open | Picard Anna R | $169,046 | |
| Previous Owner | Maclure Anna R | $167,373 |
Source: Public Records
Tax History Compared to Growth
Tax History
| Year | Tax Paid | Tax Assessment Tax Assessment Total Assessment is a certain percentage of the fair market value that is determined by local assessors to be the total taxable value of land and additions on the property. | Land | Improvement |
|---|---|---|---|---|
| 2025 | $3,699 | $270,600 | $108,900 | $161,700 |
| 2024 | $3,564 | $262,800 | $105,700 | $157,100 |
| 2023 | $2,694 | $183,900 | $83,700 | $100,200 |
| 2022 | $3,040 | $183,900 | $83,700 | $100,200 |
| 2021 | $3,361 | $191,600 | $83,700 | $107,900 |
| 2020 | $3,266 | $183,900 | $83,700 | $100,200 |
| 2019 | $2,653 | $171,600 | $83,700 | $87,900 |
| 2018 | $2,582 | $161,400 | $79,100 | $82,300 |
| 2017 | $2,511 | $154,900 | $76,000 | $78,900 |
| 2016 | $2,434 | $156,100 | $76,000 | $80,100 |
| 2015 | $2,365 | $156,100 | $76,000 | $80,100 |
Source: Public Records
Map
Nearby Homes
- 38 West St
- 33 Howard Ave
- 2 Little St
- 19 Nicols Way Unit 19
- M143 &152 Glendale St
- 6 Newell St
- 385 Main St
- 125 Park St
- 52 Williston Ave
- 5 Laurin Ln
- 33 Knipfer Ave
- 52-54 Everett St
- 41 South St Unit 11
- 98 Everett St
- 5 Lownds Ave
- 12 Glen Cove Place Unit B
- 10 Glen Cove Place Unit A
- 98 Park Hill Rd
- 2 Clinton St
- 6 S St & Abutting Lots