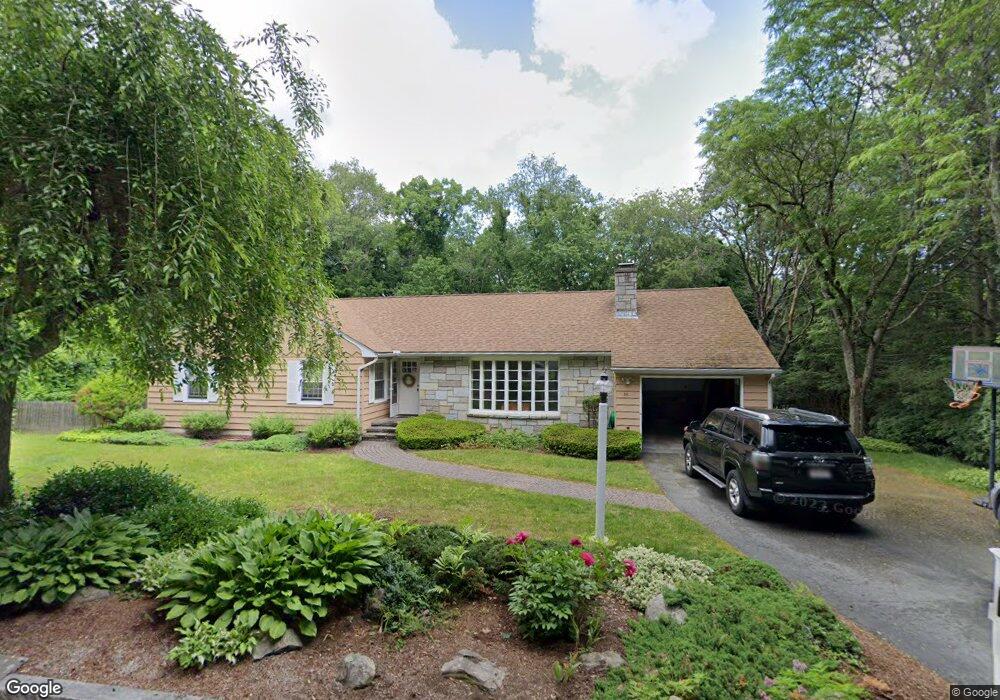
26 Wiltshire Dr Worcester, MA 01609
Forest Grove NeighborhoodEstimated Value: $579,712 - $636,000
3
Beds
3
Baths
1,922
Sq Ft
$315/Sq Ft
Est. Value
About This Home
This home is located at 26 Wiltshire Dr, Worcester, MA 01609 and is currently estimated at $605,678, approximately $315 per square foot. 26 Wiltshire Dr is a home located in Worcester County with nearby schools including Nelson Place Elementary School, Jacob Hiatt Magnet School, and Chandler Magnet.
Ownership History
Date
Name
Owned For
Owner Type
Purchase Details
Closed on
Dec 31, 2012
Sold by
Odonnell Harold H and Odonnell Kelly M
Bought by
Odonnell Kelly M
Current Estimated Value
Home Financials for this Owner
Home Financials are based on the most recent Mortgage that was taken out on this home.
Original Mortgage
$247,000
Outstanding Balance
$170,601
Interest Rate
3.38%
Mortgage Type
New Conventional
Estimated Equity
$435,077
Purchase Details
Closed on
Apr 1, 2002
Sold by
Lapre Jay S
Bought by
Odonnell Harold H and Odonnell Kelly M
Purchase Details
Closed on
Aug 27, 2001
Sold by
Sheary Joan L
Bought by
Lapre Jay S
Purchase Details
Closed on
Dec 15, 1993
Sold by
Sinasky Andrew M and Sinasky Nancy
Bought by
Sheary Joan L and Sheary Lester
Purchase Details
Closed on
Apr 1, 1987
Sold by
Sinasky Andrew M
Bought by
Sinasky Andrew M
Create a Home Valuation Report for This Property
The Home Valuation Report is an in-depth analysis detailing your home's value as well as a comparison with similar homes in the area
Home Values in the Area
Average Home Value in this Area
Purchase History
| Date | Buyer | Sale Price | Title Company |
|---|---|---|---|
| Odonnell Kelly M | -- | -- | |
| Odonnell Kelly M | -- | -- | |
| Odonnell Kelly M | -- | -- | |
| Odonnell Harold H | $335,000 | -- | |
| Odonnell Harold H | $335,000 | -- | |
| Lapre Jay S | $345,000 | -- | |
| Lapre Jay S | $345,000 | -- | |
| Sheary Joan L | $220,600 | -- | |
| Sheary Joan L | $220,600 | -- | |
| Sinasky Andrew M | $72,500 | -- |
Source: Public Records
Mortgage History
| Date | Status | Borrower | Loan Amount |
|---|---|---|---|
| Open | Odonnell Kelly M | $247,000 | |
| Closed | Sinasky Andrew M | $247,000 |
Source: Public Records
Tax History Compared to Growth
Tax History
| Year | Tax Paid | Tax Assessment Tax Assessment Total Assessment is a certain percentage of the fair market value that is determined by local assessors to be the total taxable value of land and additions on the property. | Land | Improvement |
|---|---|---|---|---|
| 2025 | $6,325 | $479,500 | $124,000 | $355,500 |
| 2024 | $6,171 | $448,800 | $124,000 | $324,800 |
| 2023 | $6,252 | $436,000 | $106,700 | $329,300 |
| 2022 | $5,593 | $367,700 | $85,400 | $282,300 |
| 2021 | $5,753 | $353,400 | $68,300 | $285,100 |
| 2020 | $5,491 | $323,000 | $68,100 | $254,900 |
| 2019 | $5,449 | $302,700 | $65,900 | $236,800 |
| 2018 | $5,251 | $277,700 | $65,900 | $211,800 |
| 2017 | $5,337 | $277,700 | $65,900 | $211,800 |
| 2016 | $5,472 | $265,500 | $55,000 | $210,500 |
| 2015 | $5,329 | $265,500 | $55,000 | $210,500 |
| 2014 | $5,301 | $271,300 | $55,000 | $216,300 |
Source: Public Records
Map
Nearby Homes
- 40 Westwood Dr
- 8 Old Colony Rd
- 577 Grove St
- 12 Alexander Rd
- 477 Salisbury St
- 42 Ellis Dr
- 11 Gifford Dr
- 9 Dennison Rd
- 23 Dryden St
- 83 Newton Ave N
- 46 Hastings Ave
- 0 Grove St
- 71 Edgeworth St Unit 21
- 42 Hastings Ave
- 87 W Boylston St
- 10 Dryden St Unit 7
- 10 Hemans St Unit 9
- 89 W Boylston St Unit 4
- 6 Milton St
- 93 W Boylston St
- 28 Wiltshire Dr
- 20 Wiltshire Dr
- 29 Wiltshire Dr
- 18 Wiltshire Dr
- 15 Hancock Hill Dr
- 32 Wiltshire Dr
- 19 Hancock Hill Dr
- 10 Wiltshire Dr
- 27 Wiltshire Dr
- 7 Hancock Hill Dr
- 21 Wiltshire Dr
- 35 Wiltshire Dr
- 23 Hancock Hill Dr
- 17 Wiltshire Dr
- 8 Wiltshire Dr
- 2 Ardmore Rd
- 42 Ardmore Rd
- 5 Hancock Hill Dr
- 4 Ardmore Rd
- 11 Wiltshire Dr