260 Capri St Morro Bay, CA 93442
Estimated Value: $792,041 - $1,073,000
2
Beds
1
Bath
1,000
Sq Ft
$977/Sq Ft
Est. Value
About This Home
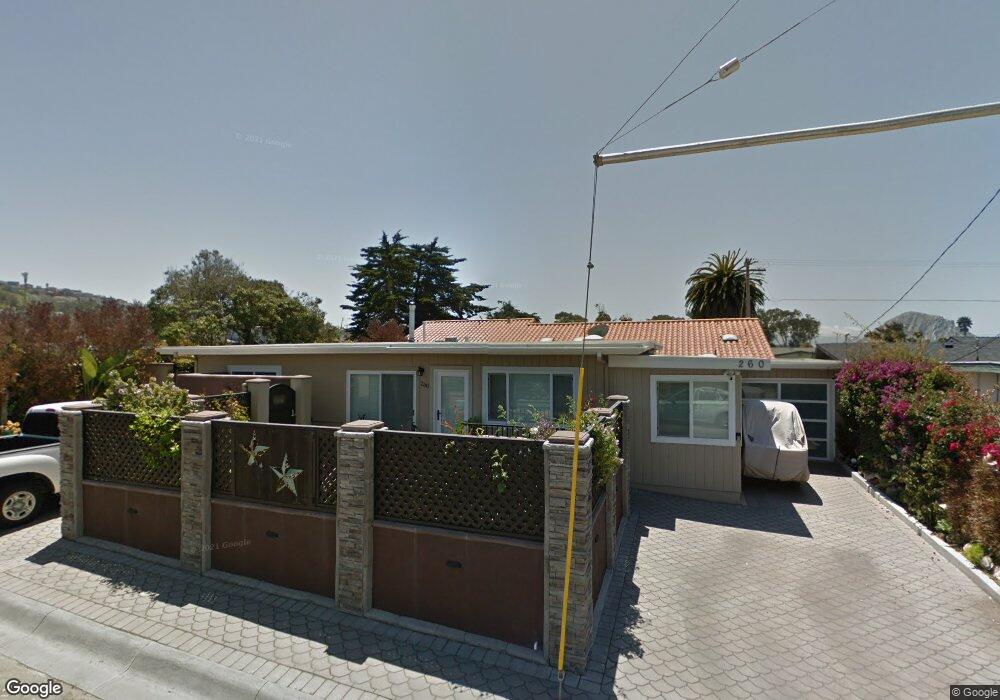
This home is located at 260 Capri St, Morro Bay, CA 93442 and is currently estimated at $976,760, approximately $976 per square foot. 260 Capri St is a home located in San Luis Obispo County with nearby schools including Del Mar Elementary School, Los Osos Middle School, and Morro Bay High School.
Ownership History
Date
Name
Owned For
Owner Type
Purchase Details
Closed on
Nov 4, 2019
Sold by
Moens Marshall J and Moens Deborah L
Bought by
Moens Marshall and Moens Deborah
Current Estimated Value
Purchase Details
Closed on
Jan 14, 1999
Sold by
Vargas Edward O and Vargas Vera M
Bought by
Moens Marshall J and Moens Deborah L
Home Financials for this Owner
Home Financials are based on the most recent Mortgage that was taken out on this home.
Original Mortgage
$146,250
Outstanding Balance
$34,009
Interest Rate
6.79%
Estimated Equity
$942,751
Create a Home Valuation Report for This Property
The Home Valuation Report is an in-depth analysis detailing your home's value as well as a comparison with similar homes in the area
Home Values in the Area
Average Home Value in this Area
Purchase History
| Date | Buyer | Sale Price | Title Company |
|---|---|---|---|
| Moens Marshall | -- | None Available | |
| Moens Marshall J | $162,500 | Fidelity National Title Co |
Source: Public Records
Mortgage History
| Date | Status | Borrower | Loan Amount |
|---|---|---|---|
| Open | Moens Marshall J | $146,250 |
Source: Public Records
Tax History Compared to Growth
Tax History
| Year | Tax Paid | Tax Assessment Tax Assessment Total Assessment is a certain percentage of the fair market value that is determined by local assessors to be the total taxable value of land and additions on the property. | Land | Improvement |
|---|---|---|---|---|
| 2025 | $2,760 | $254,732 | $156,761 | $97,971 |
| 2024 | $2,710 | $249,738 | $153,688 | $96,050 |
| 2023 | $2,710 | $244,842 | $150,675 | $94,167 |
| 2022 | $2,540 | $240,042 | $147,721 | $92,321 |
| 2021 | $2,500 | $235,336 | $144,825 | $90,511 |
| 2020 | $2,474 | $232,923 | $143,340 | $89,583 |
| 2019 | $2,449 | $228,357 | $140,530 | $87,827 |
| 2018 | $2,401 | $223,880 | $137,775 | $86,105 |
| 2017 | $2,353 | $219,491 | $135,074 | $84,417 |
| 2016 | $2,307 | $215,188 | $132,426 | $82,762 |
| 2015 | $2,272 | $211,956 | $130,437 | $81,519 |
| 2014 | $2,086 | $207,805 | $127,882 | $79,923 |
Source: Public Records
Map
Nearby Homes
- 309 Sequoia St Unit 3
- 165 Damar St
- 2900 Alder Ave
- 190 Verdon St
- 2783 Coral Ave
- 3020 Ironwood Ave
- 2825 Hemlock Ave
- 491 Luzon St
- 670 Sequoia Ct
- 650 Sequoia Ct
- 431 Nevis St
- 498 Orcas St
- 679 Elena St
- 449 Panay St
- 2675 Juniper Ave
- 408 Sicily St
- 175 Tahiti St
- 2559 Greenwood Ave
- 2637 Laurel Ave
- 2581 Juniper Ave