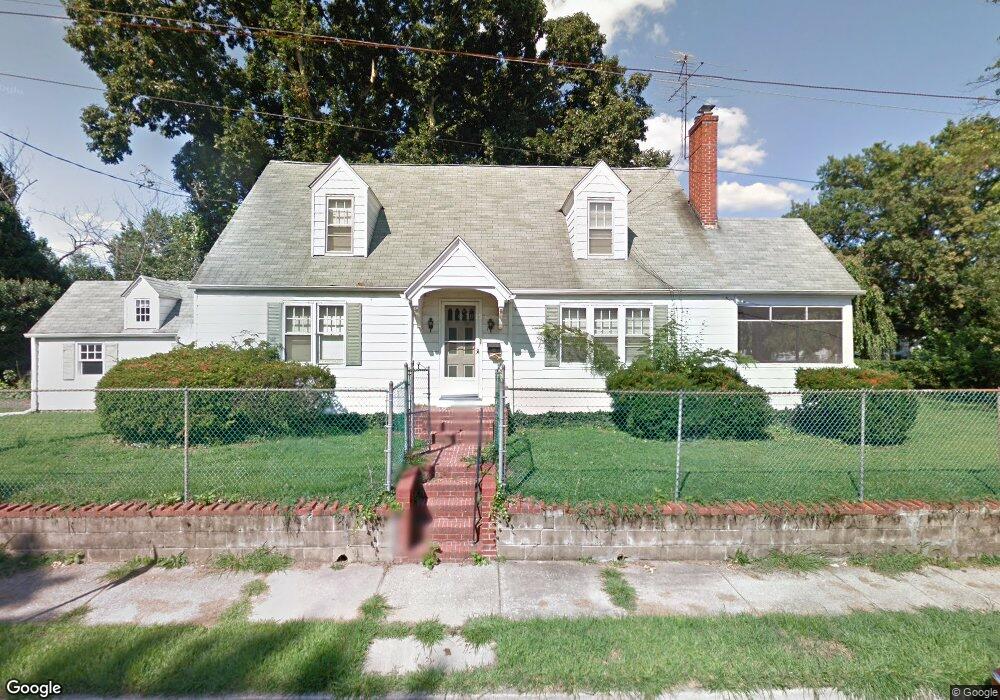
Estimated Value: $182,447 - $208,000
3
Beds
2
Baths
1,827
Sq Ft
$107/Sq Ft
Est. Value
About This Home
This home is located at 260 Gibbon St, Salem, NJ 08079 and is currently estimated at $196,362, approximately $107 per square foot. 260 Gibbon St is a home located in Salem County with nearby schools including John Fenwick Elementary School, Salem Middle School, and Salem High School.
Ownership History
Date
Name
Owned For
Owner Type
Purchase Details
Closed on
Nov 3, 2016
Sold by
Mtglq Investors Lp
Bought by
Alan Investments Iii Llc
Current Estimated Value
Purchase Details
Closed on
Mar 18, 2016
Sold by
Adams Kimberly N
Bought by
Mtglq Investors Lp
Purchase Details
Closed on
Nov 22, 2000
Sold by
Garrison Richard E
Bought by
Adams Kimberly N
Home Financials for this Owner
Home Financials are based on the most recent Mortgage that was taken out on this home.
Original Mortgage
$74,795
Interest Rate
7.76%
Mortgage Type
FHA
Create a Home Valuation Report for This Property
The Home Valuation Report is an in-depth analysis detailing your home's value as well as a comparison with similar homes in the area
Home Values in the Area
Average Home Value in this Area
Purchase History
| Date | Buyer | Sale Price | Title Company |
|---|---|---|---|
| Alan Investments Iii Llc | $12,600 | None Available | |
| Mtglq Investors Lp | -- | Attorney | |
| Adams Kimberly N | $75,000 | -- |
Source: Public Records
Mortgage History
| Date | Status | Borrower | Loan Amount |
|---|---|---|---|
| Previous Owner | Adams Kimberly N | $74,795 |
Source: Public Records
Tax History Compared to Growth
Tax History
| Year | Tax Paid | Tax Assessment Tax Assessment Total Assessment is a certain percentage of the fair market value that is determined by local assessors to be the total taxable value of land and additions on the property. | Land | Improvement |
|---|---|---|---|---|
| 2025 | $4,613 | $56,100 | $10,500 | $45,600 |
| 2024 | $4,410 | $56,100 | $10,500 | $45,600 |
| 2023 | $4,410 | $56,100 | $10,500 | $45,600 |
| 2022 | $4,217 | $56,100 | $10,500 | $45,600 |
| 2021 | $4,072 | $56,100 | $10,500 | $45,600 |
| 2020 | $3,990 | $56,100 | $10,500 | $45,600 |
| 2019 | $3,966 | $56,100 | $10,500 | $45,600 |
| 2018 | $3,879 | $56,100 | $10,500 | $45,600 |
| 2017 | $3,832 | $56,100 | $10,500 | $45,600 |
| 2016 | $4,515 | $115,300 | $15,100 | $100,200 |
| 2015 | $4,458 | $115,300 | $15,100 | $100,200 |
| 2014 | $4,434 | $115,300 | $15,100 | $100,200 |
Source: Public Records
Map
Nearby Homes