
2600 Torrey Pines Rd Unit B27 La Jolla, CA 92037
La Jolla Shores NeighborhoodEstimated payment $5,154/month
Total Views
366
2
Beds
2
Baths
1,102
Sq Ft
$680
Price per Sq Ft
Highlights
- Fitness Center
- Gated Community
- Clubhouse
- Torrey Pines Elementary School Rated A
- Craftsman Architecture
- Fireplace in Bathroom
About This Home
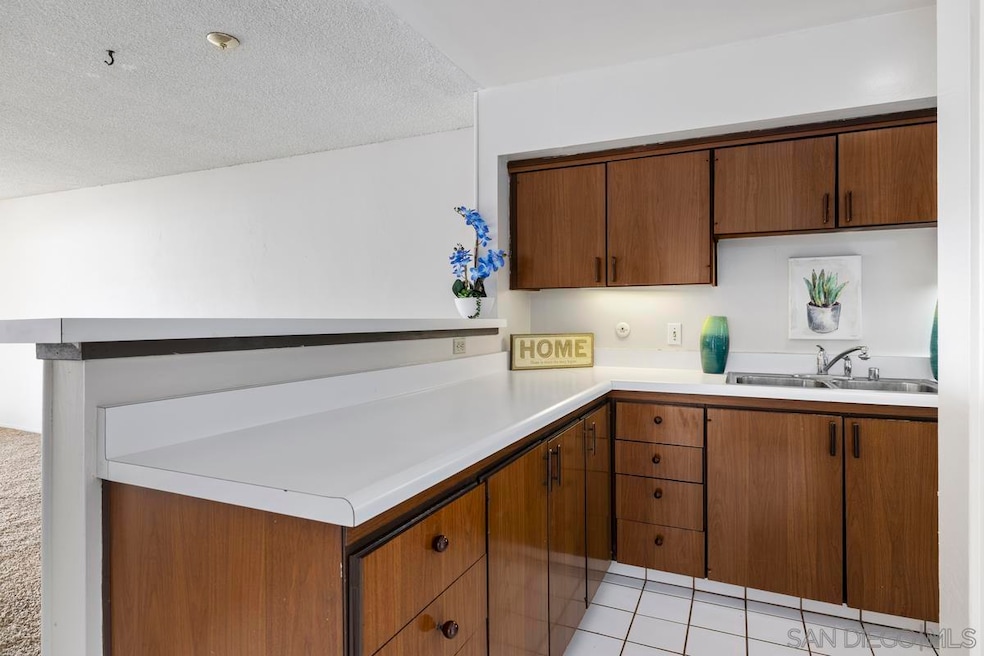
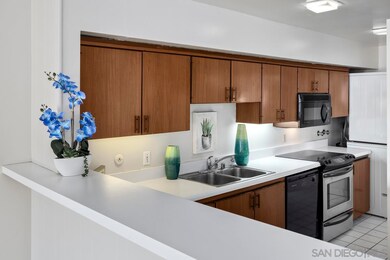
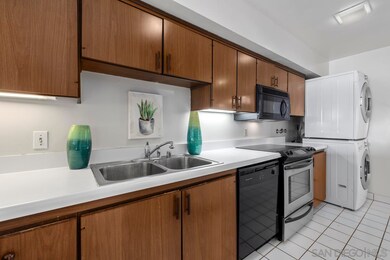
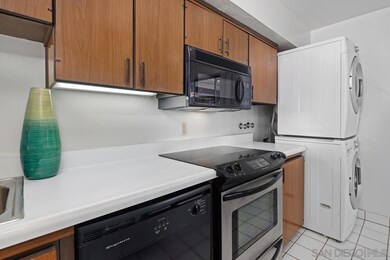
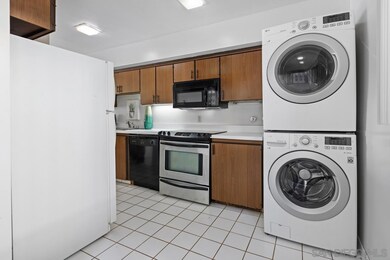
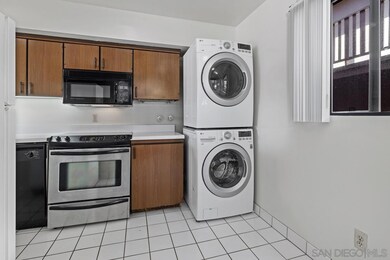
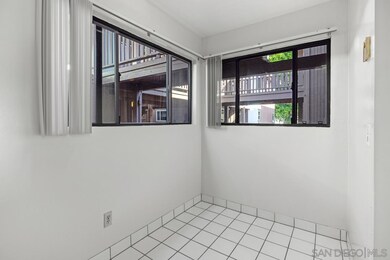
PRIME LA JOLLA LOCATION & WALKING DISTANCE TO LA JOLLA SHORES! This Spacious 2 Bedroom & 2 Baths Unit is Ready for Your Own Remodeling Designs and Personal Touches. This Ideal Floor Plan Offers Ultimate Privacy with Two Separate Bedroom Suites. The Open Concept Living Space Seamlessly Connects the Kitchen, Dining, and Living Areas, featuring a Sliding Door that Leads to a Large Balcony. Primary Bedroom Boasts a Walk-In Closet, Private Bath, and Access to The Balcony. Both Bedrooms Have Their Own Bathroom with One Offering Dual Access for Guests. In-Unit LG Fully Sized Stackable Washer/Dryer, Newer Stove, Dishwasher & Microwave and has a pantry and Tons of Natural lighting throughout! Assigned Parking Space #88 and Storage Unit B-27. BEACH LIVING AT IT’S BEST! This Location Offers Close Proximity to Downtown La Jolla Including High-End Restaurants Such as The Marine Room, George’s at the Cove, Eddie V’s, Nine-Ten, and Duke’s surrounded by Tons of Retail Shops! World-Renowned Torrey Pines Golf Course. Nearby Private Schools, UC San Diego, Scripps Institution of Oceanography, UCSD, Scripps Memorial Hospital and Rady Children’s Hospitals and Easy Freeway access!
Property Details
Home Type
- Condominium
Est. Annual Taxes
- $3,881
Year Built
- Built in 1966
Lot Details
- Property is Fully Fenced
- Fence is in fair condition
- Landscaped
HOA Fees
- $695 Monthly HOA Fees
Home Design
- Craftsman Architecture
- Cosmetic Repairs Needed
- Composition Roof
Interior Spaces
- 1,102 Sq Ft Home
- 3-Story Property
- Entryway
- Great Room
- Family Room
- Dining Area
Kitchen
- Stove
- Microwave
- Dishwasher
- Disposal
- Fireplace in Kitchen
Flooring
- Carpet
- Linoleum
- Ceramic Tile
Bedrooms and Bathrooms
- 2 Bedrooms
- Walk-In Closet
- 2 Full Bathrooms
- Fireplace in Bathroom
- Bathtub
Laundry
- Laundry in Kitchen
- Dryer
- Washer
Home Security
Parking
- 1 Parking Space
- Public Parking
- On-Street Parking
- Assigned Parking
Outdoor Features
- Balcony
- Covered patio or porch
Location
- Interior Unit
Utilities
- Cooling Available
- Radiant Heating System
- Separate Water Meter
- Water Heater
- Cable TV Available
Listing and Financial Details
- Assessor Parcel Number 346-540-28-22
Community Details
Overview
- Association fees include common area maintenance, exterior (landscaping), exterior bldg maintenance, gated community, hot water, limited insurance, roof maintenance, sewer, trash pickup, water
- 27 Units
- Prescott Association, Phone Number (760) 634-4700
- La Jolla Recquet Club Community
Amenities
- Clubhouse
Recreation
- Tennis Courts
- Fitness Center
- Community Pool
- Community Spa
- Recreational Area
- Trails
Pet Policy
- Breed Restrictions
Security
- Gated Community
- Fire and Smoke Detector
Map
Create a Home Valuation Report for This Property
The Home Valuation Report is an in-depth analysis detailing your home's value as well as a comparison with similar homes in the area
Home Values in the Area
Average Home Value in this Area
Tax History
| Year | Tax Paid | Tax Assessment Tax Assessment Total Assessment is a certain percentage of the fair market value that is determined by local assessors to be the total taxable value of land and additions on the property. | Land | Improvement |
|---|---|---|---|---|
| 2024 | $3,881 | $313,402 | $150,675 | $162,727 |
| 2023 | $3,795 | $307,258 | $147,721 | $159,537 |
| 2022 | $3,694 | $301,234 | $144,825 | $156,409 |
| 2021 | $3,669 | $295,329 | $141,986 | $153,343 |
| 2020 | $3,625 | $292,302 | $140,531 | $151,771 |
| 2019 | $3,561 | $286,572 | $137,776 | $148,796 |
| 2018 | $3,330 | $280,954 | $135,075 | $145,879 |
| 2017 | $80 | $275,446 | $132,427 | $143,019 |
| 2016 | $3,199 | $270,046 | $129,831 | $140,215 |
| 2015 | $3,152 | $265,990 | $127,881 | $138,109 |
| 2014 | $3,103 | $260,780 | $125,376 | $135,404 |
Source: Public Records
Property History
| Date | Event | Price | Change | Sq Ft Price |
|---|---|---|---|---|
| 07/12/2025 07/12/25 | Price Changed | $749,000 | -1.3% | $680 / Sq Ft |
| 07/12/2025 07/12/25 | For Sale | $759,000 | -- | $689 / Sq Ft |
Source: San Diego MLS
Purchase History
| Date | Type | Sale Price | Title Company |
|---|---|---|---|
| Interfamily Deed Transfer | -- | United Title Company San Die | |
| Interfamily Deed Transfer | -- | Fidelity Title | |
| Grant Deed | $208,000 | Fidelity National Title Co | |
| Quit Claim Deed | -- | -- | |
| Deed | $163,500 | -- |
Source: Public Records
Mortgage History
| Date | Status | Loan Amount | Loan Type |
|---|---|---|---|
| Open | $165,000 | New Conventional | |
| Closed | $170,801 | Unknown | |
| Closed | $162,500 | Stand Alone Refi Refinance Of Original Loan | |
| Closed | $164,730 | Unknown | |
| Closed | $166,400 | Purchase Money Mortgage |
Source: Public Records
Similar Homes in the area
Source: San Diego MLS
MLS Number: 250033283
APN: 346-540-28-22
Disclaimer: Certain information contained herein is derived from information provided by parties other than Homes.com. All information provided is deemed reliable, but is not guaranteed to be accurate and should be independently verified.
![]() This information is deemed reliable but not guaranteed. You should rely on this information only to decide whether or not to further investigate a particular property.
This information is deemed reliable but not guaranteed. You should rely on this information only to decide whether or not to further investigate a particular property.
BEFORE MAKING ANY OTHER DECISION, YOU SHOULD PERSONALLY INVESTIGATE THE FACTS (e.g. square footage and lot size) with the assistance of an appropriate professional. You may use this information only to identify properties you may be interested in investigating further. All uses except for personal, noncommercial use in accordance with the foregoing purpose are prohibited. Redistribution or copying of this information, any photographs or video tours is strictly
prohibited. This information is derived from the Internet Data Exchange (IDX) service provided by San Diego MLS. Displayed property listings may be held by a brokerage firm other than the broker and/or agent responsible for this display. The information and any photographs and video tours and the compilation from which they are derived is protected by copyright. Compilation © 2025 San Diego MLS.
Nearby Homes
- 2610 Torrey Pines Rd Unit C21
- 2600 Torrey Pines Rd Unit A13
- 2600 Torrey Pines Rd Unit A31
- 2630 Torrey Pines Rd Unit E22
- 2510 Torrey Pines Unit 212
- 2842 Torrey Pines Rd
- 2500 Torrey Pines Rd Unit 1205
- 2500 Torrey Pines Rd Unit 805
- 2500 Torrey Pines Rd Unit 1101
- 2500 Torrey Pines Rd Unit 1001
- 2500 Torrey Pines Rd Unit 1202
- 2435 Paseo Dorado
- 2400 Torrey Pines Rd Unit 112
- 2888 Torrey Pines Rd
- 7778 Starlight Dr
- 2352 Torrey Pines Rd
- 8031 La Jolla Shores Dr
- 8273 Caminito Lacayo
- 8014 La Jolla Shores Dr
- 8305 Calle Del Cielo
- 2638-2758 Torrey Pines Rd
- 2510 Torrey Pines Rd Unit 316
- 2510 Torrey Pines Rd Unit La Jolla Shores Condo
- 2624 Costebelle Dr
- 2420 Torrey Pines Rd Unit 304B
- 2420 Torrey Pines Rd Unit A104
- 2684 Costebelle Dr
- 2452 Azure Coast Dr
- 2605 Calle Del Oro
- 2585 Calle Del Oro
- 2368 Torrey Pines Rd Unit 61
- 8294 Prestwick Dr
- 2643 Hidden Valley Rd
- 7967 Paseo Del Ocaso
- 2122 Paseo Dorado
- 8176 La Jolla Shores Dr
- 8070 La Jolla Scenic Dr N
- 8115 El Paseo Grande
- 8001 Calle de la Plata
- 7904 Calle de la Plata