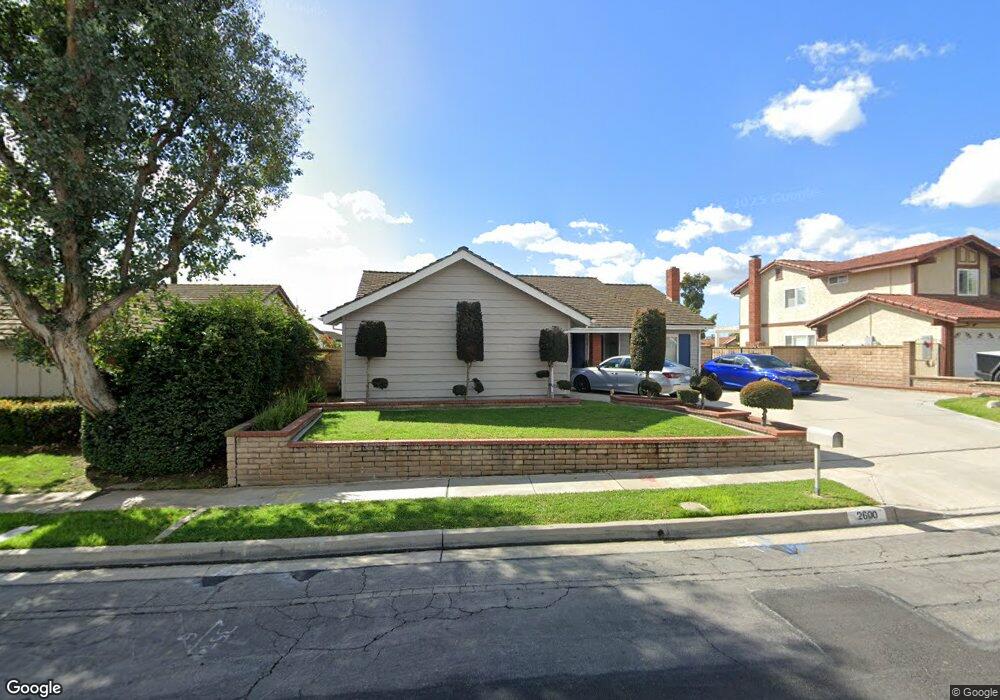
2600 Trieste Way Fullerton, CA 92833
Sunny Hills NeighborhoodEstimated Value: $1,158,609 - $1,375,000
4
Beds
2
Baths
1,900
Sq Ft
$681/Sq Ft
Est. Value
About This Home
This home is located at 2600 Trieste Way, Fullerton, CA 92833 and is currently estimated at $1,293,402, approximately $680 per square foot. 2600 Trieste Way is a home located in Orange County with nearby schools including Robert C. Fisler Elementary School, Sunny Hills High School, and Arborland Montessori - Hughes Dr. Campus.
Ownership History
Date
Name
Owned For
Owner Type
Purchase Details
Closed on
Feb 26, 2021
Sold by
Ostensen Lyndon P and Ostensen Concetta Blackstone
Bought by
The Blackstone Ostensen Family Trust
Current Estimated Value
Purchase Details
Closed on
Jan 24, 2013
Sold by
Blackstone Ostensen Concetta and Prevost Patricia A
Bought by
Ostensen Lyndon P and Blackstone Ostensen Concetta
Home Financials for this Owner
Home Financials are based on the most recent Mortgage that was taken out on this home.
Original Mortgage
$260,000
Outstanding Balance
$181,081
Interest Rate
3.33%
Mortgage Type
New Conventional
Estimated Equity
$1,112,321
Purchase Details
Closed on
Nov 4, 1999
Sold by
Agnes Bruno Nancy
Bought by
Bruno Nancy A and Blackstone Ostensen Concetta
Purchase Details
Closed on
Jun 6, 1994
Sold by
Bruno Nancy Agnes
Bought by
Bruno Nancy A
Create a Home Valuation Report for This Property
The Home Valuation Report is an in-depth analysis detailing your home's value as well as a comparison with similar homes in the area
Home Values in the Area
Average Home Value in this Area
Purchase History
| Date | Buyer | Sale Price | Title Company |
|---|---|---|---|
| The Blackstone Ostensen Family Trust | -- | None Available | |
| Ostensen Lyndon P | $520,000 | Oak Hills Land Title Agency | |
| Bruno Nancy A | -- | -- | |
| Bruno Nancy A | -- | -- |
Source: Public Records
Mortgage History
| Date | Status | Borrower | Loan Amount |
|---|---|---|---|
| Open | Ostensen Lyndon P | $260,000 |
Source: Public Records
Tax History
| Year | Tax Paid | Tax Assessment Tax Assessment Total Assessment is a certain percentage of the fair market value that is determined by local assessors to be the total taxable value of land and additions on the property. | Land | Improvement |
|---|---|---|---|---|
| 2025 | $2,785 | $228,832 | $114,518 | $114,314 |
| 2024 | $2,785 | $224,346 | $112,273 | $112,073 |
| 2023 | $2,716 | $219,948 | $110,072 | $109,876 |
| 2022 | $2,693 | $215,636 | $107,914 | $107,722 |
| 2021 | $2,647 | $211,408 | $105,798 | $105,610 |
| 2020 | $2,632 | $209,241 | $104,713 | $104,528 |
| 2019 | $2,569 | $205,139 | $102,660 | $102,479 |
| 2018 | $2,531 | $201,117 | $100,647 | $100,470 |
| 2017 | $2,490 | $197,174 | $98,674 | $98,500 |
| 2016 | $2,440 | $193,308 | $96,739 | $96,569 |
| 2015 | $2,375 | $190,405 | $95,286 | $95,119 |
| 2014 | $2,308 | $186,676 | $93,420 | $93,256 |
Source: Public Records
Map
Nearby Homes
- 921 Creekside Dr Unit 131
- 2426 Plaza de Vista
- 2709 Baycrest Place
- 926 Whitewater Dr Unit 96
- 1216 Mcfadden Dr
- 2523 Cypress Point Dr
- 904 Whitewater Dr Unit 6
- 1605 Avenida Selva Unit 217
- 804 Creekside Dr Unit 56
- 2720 Gallio Dr
- 1715 Fairford Dr
- 5471 Jonesboro Way
- 8365 Kiley Ct
- 2090 Arnold Way
- 2009 W Las Lanas Ln
- 1478 Christie St
- 2019 Arnold Way Unit 58
- 6 Tidewater Cove
- 1249 Nicolas St
- 2505 Regency Cir
- 2606 Trieste Way
- 2518 Trieste Way
- 2613 Athena Place
- 2619 Athena Place
- 2614 Trieste Way
- 2607 Athena Place
- 2512 Trieste Way
- 2601 Trieste Way
- 2625 Athena Place
- 2607 Trieste Way
- 1300 Carleton Way
- 2615 Trieste Way
- 2622 Trieste Way
- 2600 Athena Place
- 2631 Athena Place
- 1306 Carleton Way
- 1265 Candlewood Dr
- 1257 Candlewood Dr
- 1301 Candlewood Dr
- 2621 Trieste Way
Your Personal Tour Guide
Ask me questions while you tour the home.