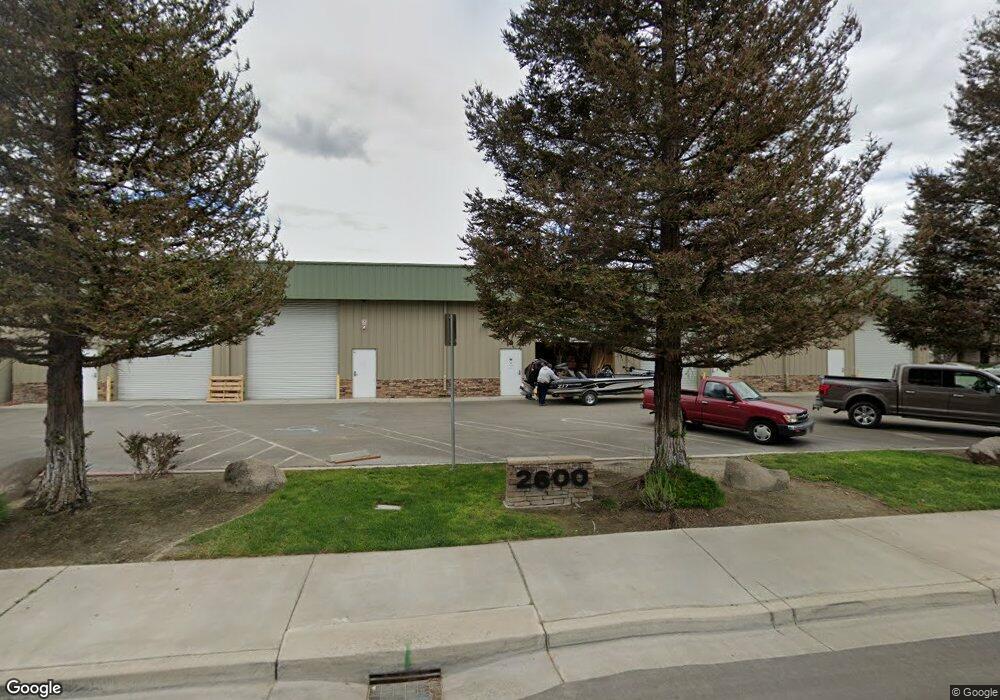
2600 Tully Rd Hughson, CA 95326
Estimated Value: $908,129
Studio
--
Bath
7,840
Sq Ft
$116/Sq Ft
Est. Value
About This Home
This home is located at 2600 Tully Rd, Hughson, CA 95326 and is currently estimated at $908,129, approximately $115 per square foot. 2600 Tully Rd is a home located in Stanislaus County with nearby schools including Hughson Elementary School, Fox Road Elementary School, and Emilie J. Ross Middle School.
Ownership History
Date
Name
Owned For
Owner Type
Purchase Details
Closed on
Nov 10, 2022
Sold by
R & S Steele 1998 Revocable Trust
Bought by
Patterson James D
Current Estimated Value
Home Financials for this Owner
Home Financials are based on the most recent Mortgage that was taken out on this home.
Original Mortgage
$717,900
Outstanding Balance
$696,163
Interest Rate
7.08%
Mortgage Type
New Conventional
Estimated Equity
$211,966
Purchase Details
Closed on
Dec 14, 2009
Sold by
Steele Randall and Steele Susan
Bought by
Steele Randall and Steele Susan
Home Financials for this Owner
Home Financials are based on the most recent Mortgage that was taken out on this home.
Original Mortgage
$250,000
Interest Rate
4.88%
Mortgage Type
Commercial
Purchase Details
Closed on
Nov 10, 2009
Sold by
Saso Dustin and Saso Andrea Kate
Bought by
Steele Randall and Steele Susan
Home Financials for this Owner
Home Financials are based on the most recent Mortgage that was taken out on this home.
Original Mortgage
$250,000
Interest Rate
4.88%
Mortgage Type
Commercial
Purchase Details
Closed on
Dec 7, 2004
Sold by
Martella Ronald and Martella Jane C
Bought by
Saso Dustin and Saso Andrea Kate
Create a Home Valuation Report for This Property
The Home Valuation Report is an in-depth analysis detailing your home's value as well as a comparison with similar homes in the area
Home Values in the Area
Average Home Value in this Area
Purchase History
| Date | Buyer | Sale Price | Title Company |
|---|---|---|---|
| Patterson James D | $845,000 | Chicago Title | |
| Patterson James D | -- | Chicago Title | |
| Steele Randall | -- | Old Republic Title Company | |
| Steele Randall | $475,000 | Old Republic Title Company | |
| Saso Dustin | $115,000 | Chicago Title |
Source: Public Records
Mortgage History
| Date | Status | Borrower | Loan Amount |
|---|---|---|---|
| Open | Patterson James D | $717,900 | |
| Previous Owner | Steele Randall | $250,000 |
Source: Public Records
Tax History
| Year | Tax Paid | Tax Assessment Tax Assessment Total Assessment is a certain percentage of the fair market value that is determined by local assessors to be the total taxable value of land and additions on the property. | Land | Improvement |
|---|---|---|---|---|
| 2025 | $11,188 | $879,137 | $153,979 | $725,158 |
| 2024 | $10,566 | $861,900 | $150,960 | $710,940 |
| 2023 | $10,348 | $845,000 | $148,000 | $697,000 |
| 2022 | $7,484 | $577,767 | $155,690 | $422,077 |
| 2021 | $7,362 | $566,439 | $152,638 | $413,801 |
| 2020 | $7,270 | $560,631 | $151,073 | $409,558 |
| 2019 | $7,209 | $549,639 | $148,111 | $401,528 |
| 2018 | $7,022 | $538,862 | $145,207 | $393,655 |
| 2017 | $7,073 | $528,297 | $142,360 | $385,937 |
| 2016 | $6,732 | $517,939 | $139,569 | $378,370 |
| 2015 | $6,360 | $484,000 | $65,500 | $418,500 |
| 2014 | $5,963 | $440,000 | $59,500 | $380,500 |
Source: Public Records
Map
Nearby Homes
- 5575 E Whitmore Ave
- 2324 6th St
- 2117 Vincent Ave
- 7501 Vixen Ct
- 1708 Feathers Ct
- 6605 Narcisco Way
- 6904 Melody Ct
- 1808 Apiary Way
- 1601 Redhaven Place
- 6400 Snow Beauty Way
- 1619 7th St
- 1606 Symphony Ln
- 6329 Snow Beauty Way
- 7009 Finale Ln
- 6216 Honey Haven Ln
- 6400 E Hatch Rd
- 6154 Honey Haven Ln
- 6150 Honey Haven Ln
- 6200 Honey Haven Ln
- 6221 Honey Haven Ln
- 6713 Joe Ruddy Ct
- 6724 E Whitmore Ave Unit L&M
- 6724 E Whitmore Ave
- 6700 Joe Ruddy Ct
- 6724 Joe Ruddy Ct
- 2442 Tully Rd Unit 18
- 5755 E Whitmore Ave
- 6600 E Whitmore Ave
- 11750 E Whitmore Ave
- 0 E Whitmore Ave
- 6560 E Whitmore Ave
- 2907 Tully Rd
- 2462 Santa fe Ave
- 2451 3rd St
- 6524 E Whitmore Ave
- 6900 Elm St
- 6530 E Whitmore Ave
- 2931 Tully Rd
- 6908 Elm St
- 6908 Elm St Unit 6
Your Personal Tour Guide
Ask me questions while you tour the home.