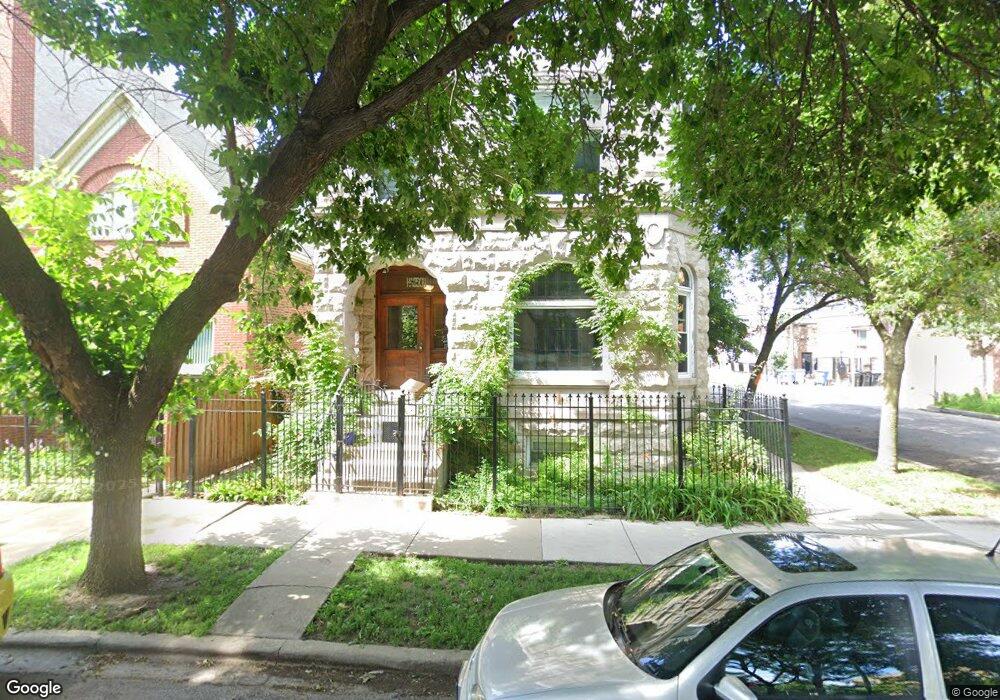
2600 W Haddon Ave Unit 3F Chicago, IL 60622
Humboldt Park NeighborhoodEstimated Value: $332,000 - $479,000
4
Beds
2
Baths
1,200
Sq Ft
$335/Sq Ft
Est. Value
About This Home
This home is located at 2600 W Haddon Ave Unit 3F, Chicago, IL 60622 and is currently estimated at $401,644, approximately $334 per square foot. 2600 W Haddon Ave Unit 3F is a home located in Cook County with nearby schools including Chopin Elementary School, Clemente Community Academy High School, and Acero - Esmera Santiago Elementary School.
Ownership History
Date
Name
Owned For
Owner Type
Purchase Details
Closed on
Jul 18, 2022
Sold by
Armbrust Juliana J and Razo Richard J
Bought by
Armbrust Juliana J and Razo Richard J
Current Estimated Value
Home Financials for this Owner
Home Financials are based on the most recent Mortgage that was taken out on this home.
Original Mortgage
$158,000
Outstanding Balance
$148,794
Interest Rate
4%
Mortgage Type
New Conventional
Estimated Equity
$252,850
Purchase Details
Closed on
May 12, 2015
Sold by
Armbrust Juliana and Armbrust Sharon
Bought by
Armbrust Juliana J and Razo Richard J
Purchase Details
Closed on
Nov 21, 2005
Sold by
The Haddon Place Llc
Bought by
Armbrust Juliana and Armbrust Sharon R
Home Financials for this Owner
Home Financials are based on the most recent Mortgage that was taken out on this home.
Original Mortgage
$220,000
Interest Rate
6.12%
Mortgage Type
Fannie Mae Freddie Mac
Create a Home Valuation Report for This Property
The Home Valuation Report is an in-depth analysis detailing your home's value as well as a comparison with similar homes in the area
Home Values in the Area
Average Home Value in this Area
Purchase History
| Date | Buyer | Sale Price | Title Company |
|---|---|---|---|
| Armbrust Juliana J | -- | None Listed On Document | |
| Armbrust Juliana J | -- | Fidelity Natl Title Ins Co | |
| Armbrust Juliana | $275,000 | Multiple |
Source: Public Records
Mortgage History
| Date | Status | Borrower | Loan Amount |
|---|---|---|---|
| Open | Armbrust Juliana J | $158,000 | |
| Previous Owner | Armbrust Juliana | $220,000 |
Source: Public Records
Tax History Compared to Growth
Tax History
| Year | Tax Paid | Tax Assessment Tax Assessment Total Assessment is a certain percentage of the fair market value that is determined by local assessors to be the total taxable value of land and additions on the property. | Land | Improvement |
|---|---|---|---|---|
| 2024 | $5,764 | $36,648 | $4,149 | $32,499 |
| 2023 | $5,581 | $30,555 | $1,889 | $28,666 |
| 2022 | $5,581 | $30,555 | $1,889 | $28,666 |
| 2021 | $5,474 | $30,554 | $1,889 | $28,665 |
| 2020 | $4,929 | $25,666 | $1,889 | $23,777 |
| 2019 | $5,014 | $28,386 | $1,889 | $26,497 |
| 2018 | $4,929 | $28,386 | $1,889 | $26,497 |
| 2017 | $4,125 | $22,537 | $1,667 | $20,870 |
| 2016 | $4,014 | $22,537 | $1,667 | $20,870 |
| 2015 | $3,649 | $22,537 | $1,667 | $20,870 |
| 2014 | $3,558 | $21,746 | $1,500 | $20,246 |
| 2013 | $3,477 | $21,746 | $1,500 | $20,246 |
Source: Public Records
Map
Nearby Homes
- 2601 W Haddon Ave Unit 2E
- 1046 N Rockwell St
- 2651 W Haddon Ave Unit 1
- 2514 W Thomas St
- 1214 N Rockwell St
- 2708 W Thomas St Unit 2
- 2712 W Crystal St
- 2647 W Cortez St
- 2554 W Augusta Blvd
- 2714 W Cortez St Unit 1
- 1058 N Campbell Ave
- 2456 W Cortez St Unit 3E
- 2456 W Cortez St Unit 2E
- 2456 W Cortez St Unit 3W
- 2651 W Augusta Blvd Unit 3
- 2651 W Augusta Blvd Unit 1
- 2515 W Augusta Blvd Unit 3S
- 1005 N Campbell Ave Unit 3
- 1045 N California Ave
- 1247 N Campbell Ave
- 2600 W Haddon Ave Unit 2F
- 2600 W Haddon Ave Unit 1F
- 2600 W Haddon Ave Unit P4
- 2600 W Haddon Ave Unit P3
- 2600 W Haddon Ave Unit P2
- 2600 W Haddon Ave Unit 2R
- 2600 W Haddon Ave Unit 1R
- 2600 W Haddon Ave Unit P1
- 1138 N Rockwell St Unit 3R
- 1138 N Rockwell St Unit 2R
- 1138 N Rockwell St Unit 1R
- 2604 W Haddon Ave
- 2606 W Haddon Ave
- 2608 W Haddon Ave
- 2558 W Haddon Ave Unit 1
- 2558 W Haddon Ave Unit 3
- 2558 W Haddon Ave Unit 2
- 2558 W Haddon Ave
- 2556 W Haddon Ave
- 2556 W Haddon Ave Unit SFKB