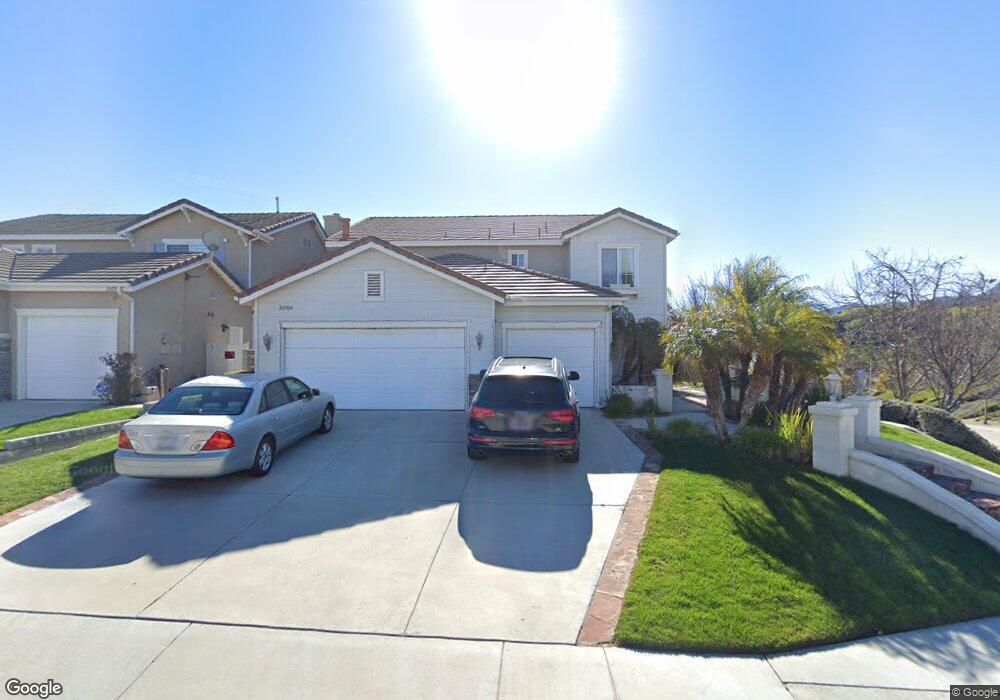
26004 Salinger Ln Stevenson Ranch, CA 91381
Estimated Value: $1,009,243 - $1,144,000
4
Beds
3
Baths
2,319
Sq Ft
$477/Sq Ft
Est. Value
About This Home
This home is located at 26004 Salinger Ln, Stevenson Ranch, CA 91381 and is currently estimated at $1,106,311, approximately $477 per square foot. 26004 Salinger Ln is a home located in Los Angeles County with nearby schools including Stevenson Ranch Elementary School, Rancho Pico Junior High School, and West Ranch High School.
Ownership History
Date
Name
Owned For
Owner Type
Purchase Details
Closed on
Jan 15, 2009
Sold by
Patel Anant and Patel Vasantibahen
Bought by
Patel Anant and Patel Vasantibahen
Current Estimated Value
Purchase Details
Closed on
Aug 29, 2002
Sold by
Messa Alan D and Messa Julie A
Bought by
Patel Anant and Patel Vasantibahen
Home Financials for this Owner
Home Financials are based on the most recent Mortgage that was taken out on this home.
Original Mortgage
$330,000
Outstanding Balance
$137,148
Interest Rate
6.17%
Estimated Equity
$969,163
Purchase Details
Closed on
Jan 5, 1996
Sold by
Richmond American Homes Of Ca Inc
Bought by
Messa Alan D and Messa Julie A
Home Financials for this Owner
Home Financials are based on the most recent Mortgage that was taken out on this home.
Original Mortgage
$256,600
Interest Rate
6.87%
Create a Home Valuation Report for This Property
The Home Valuation Report is an in-depth analysis detailing your home's value as well as a comparison with similar homes in the area
Home Values in the Area
Average Home Value in this Area
Purchase History
| Date | Buyer | Sale Price | Title Company |
|---|---|---|---|
| Patel Anant | -- | None Available | |
| Patel Anant | -- | None Available | |
| Patel Anant | $434,500 | Fidelity National Title Co | |
| Messa Alan D | $270,500 | Old Republic Title |
Source: Public Records
Mortgage History
| Date | Status | Borrower | Loan Amount |
|---|---|---|---|
| Open | Patel Anant | $330,000 | |
| Previous Owner | Messa Alan D | $256,600 |
Source: Public Records
Tax History Compared to Growth
Tax History
| Year | Tax Paid | Tax Assessment Tax Assessment Total Assessment is a certain percentage of the fair market value that is determined by local assessors to be the total taxable value of land and additions on the property. | Land | Improvement |
|---|---|---|---|---|
| 2025 | $9,879 | $629,278 | $355,699 | $273,579 |
| 2024 | $9,879 | $616,940 | $348,725 | $268,215 |
| 2023 | $9,395 | $604,844 | $341,888 | $262,956 |
| 2022 | $9,175 | $592,985 | $335,185 | $257,800 |
| 2021 | $9,352 | $581,359 | $328,613 | $252,746 |
| 2019 | $9,727 | $564,117 | $318,867 | $245,250 |
| 2018 | $9,460 | $553,057 | $312,615 | $240,442 |
| 2016 | $9,035 | $531,583 | $300,477 | $231,106 |
| 2015 | $8,833 | $523,599 | $295,964 | $227,635 |
| 2014 | $8,849 | $513,343 | $290,167 | $223,176 |
Source: Public Records
Map
Nearby Homes
- 26064 Twain Place
- 27415 Creekwood Ln
- 27403 Creekwood Ln
- 25730 Wordsworth Ln
- 25804 Webster Place
- 25707 Lewis Way
- 25614 Housman Place
- 25547 Clemens Ct
- 25614 Lewis Way
- 25518 Hemingway Ave Unit A
- 25512 Wilde Ave
- 25815 Forsythe Way
- 25710 Wagner Way Unit C
- 25710 Wagner Way Unit C
- 25769 Oak Leaf Ct
- 25768 Perlman Place Unit A
- 25514 Baker Place
- 26505 Thackery Ln
- 26511 Thackery Ln
- 26012 Franklin Ln
- 26008 Salinger Ln
- 26012 Salinger Ln
- 26009 Ohara Ln
- 26005 Ohara Ln
- 26013 Ohara Ln
- 26016 Salinger Ln
- 25922 Twain Place
- 26017 Ohara Ln
- 26003 Salinger Ln
- 25916 Twain Place
- 26007 Salinger Ln
- 25926 Twain Place
- 26011 Salinger Ln
- 26020 Salinger Ln
- 26021 Ohara Ln
- 25910 Twain Place
- 26015 Salinger Ln
- 26021 O'Hara Ln
- 25932 Twain Place
- 26024 Salinger Ln