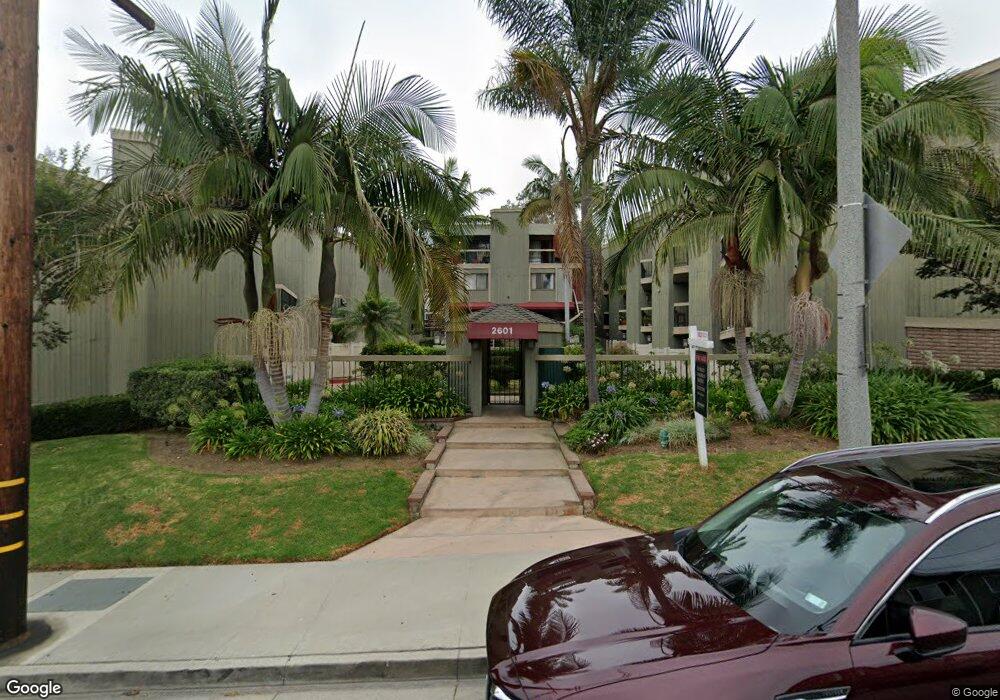
2601 E 19th St Unit 11 Signal Hill, CA 90755
Estimated Value: $592,377 - $646,000
2
Beds
3
Baths
1,263
Sq Ft
$487/Sq Ft
Est. Value
About This Home
This home is located at 2601 E 19th St Unit 11, Signal Hill, CA 90755 and is currently estimated at $615,094, approximately $487 per square foot. 2601 E 19th St Unit 11 is a home located in Los Angeles County with nearby schools including Alvarado Elementary, Nelson Academy, and Woodrow Wilson High School.
Ownership History
Date
Name
Owned For
Owner Type
Purchase Details
Closed on
Jul 25, 2011
Sold by
Clark Kimberly D
Bought by
Whiteleather Taryn
Current Estimated Value
Home Financials for this Owner
Home Financials are based on the most recent Mortgage that was taken out on this home.
Original Mortgage
$244,000
Outstanding Balance
$168,023
Interest Rate
4.53%
Mortgage Type
New Conventional
Estimated Equity
$447,071
Purchase Details
Closed on
Jun 3, 1999
Sold by
Stringer John A and Stringer Peggy L
Bought by
Clark Kimberly D
Home Financials for this Owner
Home Financials are based on the most recent Mortgage that was taken out on this home.
Original Mortgage
$162,960
Interest Rate
7.24%
Mortgage Type
FHA
Purchase Details
Closed on
Mar 14, 1994
Sold by
Kosewski John S and Kosewski Barbara
Bought by
Stringer John A and Stringer Peggy L
Home Financials for this Owner
Home Financials are based on the most recent Mortgage that was taken out on this home.
Original Mortgage
$173,400
Interest Rate
7.79%
Mortgage Type
Assumption
Create a Home Valuation Report for This Property
The Home Valuation Report is an in-depth analysis detailing your home's value as well as a comparison with similar homes in the area
Home Values in the Area
Average Home Value in this Area
Purchase History
| Date | Buyer | Sale Price | Title Company |
|---|---|---|---|
| Whiteleather Taryn | $305,000 | Chicago Title Company | |
| Clark Kimberly D | $168,000 | North American Title Co | |
| Stringer John A | $170,000 | Fidelity National Title Ins |
Source: Public Records
Mortgage History
| Date | Status | Borrower | Loan Amount |
|---|---|---|---|
| Open | Whiteleather Taryn | $244,000 | |
| Previous Owner | Clark Kimberly D | $162,960 | |
| Previous Owner | Stringer John A | $173,400 |
Source: Public Records
Tax History Compared to Growth
Tax History
| Year | Tax Paid | Tax Assessment Tax Assessment Total Assessment is a certain percentage of the fair market value that is determined by local assessors to be the total taxable value of land and additions on the property. | Land | Improvement |
|---|---|---|---|---|
| 2025 | $5,085 | $383,084 | $157,126 | $225,958 |
| 2024 | $5,085 | $375,574 | $154,046 | $221,528 |
| 2023 | $5,001 | $368,211 | $151,026 | $217,185 |
| 2022 | $4,702 | $360,992 | $148,065 | $212,927 |
| 2021 | $4,606 | $353,914 | $145,162 | $208,752 |
| 2019 | $4,539 | $343,418 | $140,857 | $202,561 |
| 2018 | $4,426 | $336,686 | $138,096 | $198,590 |
| 2016 | $4,080 | $323,615 | $132,735 | $190,880 |
| 2015 | $3,926 | $318,755 | $130,742 | $188,013 |
| 2014 | $3,902 | $312,512 | $128,181 | $184,331 |
Source: Public Records
Map
Nearby Homes
- 2604 E 20th St Unit 304F
- 2722 E 20th St Unit 104
- 1994 Stanley Ave
- 2720 E Wall St
- 1837 Temple Ave Unit C
- 1988 Junipero Ave
- 2071 Crescent Dr
- 1717 Temple Ave
- 2701 E 17th St
- 1822 Orizaba Ave
- 1720 Junipero Ave
- 2150 Ohio Ave Unit E
- 1845 Dawson Ave
- 2125 Ridgeview Terrace Dr
- 2199 Ohio Ave
- 1887 Saint Louis Ave
- 1600 Junipero Ave
- 1965 Saint Louis Ave
- 1509 Stanley Ave Unit 203
- 2507 E 15th St Unit 304
- 2601 E 19th St
- 2601 E 19th St Unit 19
- 2601 E 19th St Unit 17
- 2601 E 19th St Unit 16
- 2601 E 19th St Unit 15
- 2601 E 19th St Unit 13
- 2601 E 19th St Unit 12
- 2601 E 19th St Unit 10
- 2601 E 19th St Unit 9
- 2601 E 19th St Unit 8
- 2601 E 19th St Unit 7
- 2601 E 19th St Unit 6
- 2601 E 19th St Unit 5
- 2601 E 19th St Unit 4
- 2601 E 19th St Unit 29
- 2601 E 19th St Unit 28
- 2601 E 19th St Unit 27
- 2601 E 19th St Unit 26
- 2601 E 19th St Unit 25
- 2601 E 19th St Unit 24