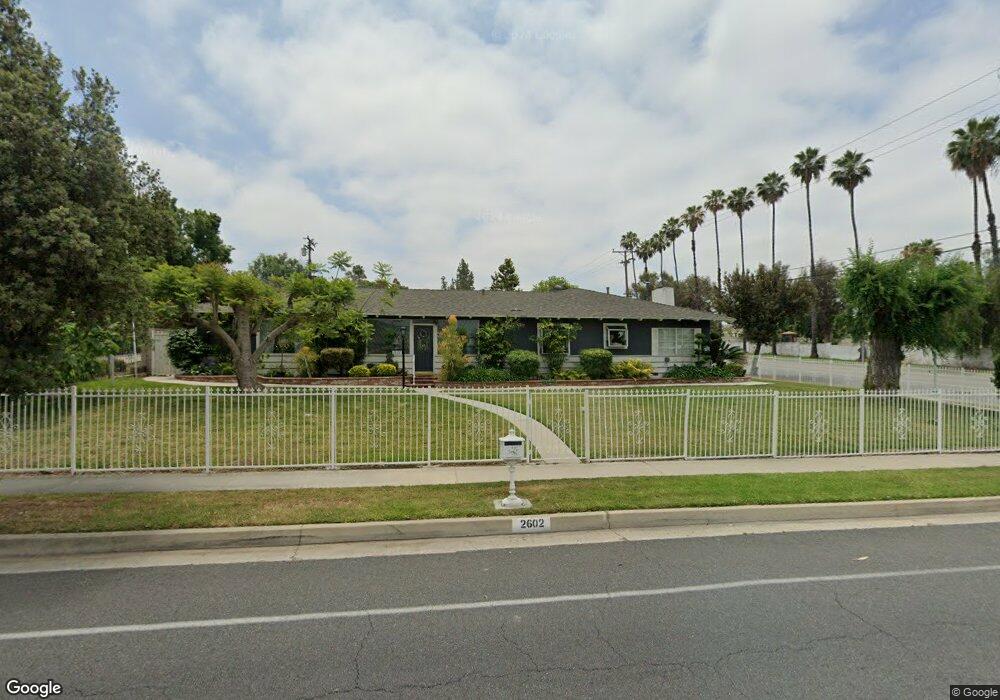
2602 E Cameron Ave West Covina, CA 91791
South Hills NeighborhoodEstimated Value: $945,409 - $1,107,000
3
Beds
2
Baths
2,350
Sq Ft
$432/Sq Ft
Est. Value
About This Home
This home is located at 2602 E Cameron Ave, West Covina, CA 91791 and is currently estimated at $1,015,352, approximately $432 per square foot. 2602 E Cameron Ave is a home located in Los Angeles County with nearby schools including Mesa Elementary School, South Hills High School, and Christ Lutheran School.
Ownership History
Date
Name
Owned For
Owner Type
Purchase Details
Closed on
Apr 27, 2007
Sold by
Delgado Gilbert A and Delgado Maria A
Bought by
Delgado Gilbert and Delgado Maria A
Current Estimated Value
Purchase Details
Closed on
Apr 5, 2005
Sold by
Lorey Robert F and Lorey Nancy A
Bought by
Delgado Gilbert A and Delgado Maria A
Purchase Details
Closed on
May 6, 1994
Sold by
Lorey Robert F and Lorey Nancy A
Bought by
Lorey Robert F and Lorey Nancy A
Purchase Details
Closed on
May 4, 1994
Sold by
Vander Haeghen Gary
Bought by
Lorey Robert F and Lorey Nancy A
Purchase Details
Closed on
Aug 23, 1991
Sold by
Lorey Robert F and Lorey Nancy Ann
Bought by
Lorey Robert F and Lorey Nancy A
Home Financials for this Owner
Home Financials are based on the most recent Mortgage that was taken out on this home.
Original Mortgage
$200,000
Interest Rate
5.6%
Create a Home Valuation Report for This Property
The Home Valuation Report is an in-depth analysis detailing your home's value as well as a comparison with similar homes in the area
Home Values in the Area
Average Home Value in this Area
Purchase History
| Date | Buyer | Sale Price | Title Company |
|---|---|---|---|
| Delgado Gilbert | -- | None Available | |
| Delgado Gilbert A | $650,000 | Itc | |
| Lorey Robert F | -- | Orange Coast Title | |
| Lorey Robert F | $295,000 | Orange Coast Title | |
| Lorey Robert F | -- | American | |
| Lorey Robert F | -- | American Title Co |
Source: Public Records
Mortgage History
| Date | Status | Borrower | Loan Amount |
|---|---|---|---|
| Previous Owner | Lorey Robert F | $200,000 |
Source: Public Records
Tax History Compared to Growth
Tax History
| Year | Tax Paid | Tax Assessment Tax Assessment Total Assessment is a certain percentage of the fair market value that is determined by local assessors to be the total taxable value of land and additions on the property. | Land | Improvement |
|---|---|---|---|---|
| 2025 | $2,431 | $161,315 | $28,652 | $132,663 |
| 2024 | $2,431 | $158,153 | $28,091 | $130,062 |
| 2023 | $2,396 | $155,053 | $27,541 | $127,512 |
| 2022 | $2,363 | $152,013 | $27,001 | $125,012 |
| 2021 | $2,322 | $149,033 | $26,472 | $122,561 |
| 2020 | $2,290 | $147,506 | $26,201 | $121,305 |
| 2019 | $2,263 | $144,615 | $25,688 | $118,927 |
| 2018 | $2,052 | $141,781 | $25,185 | $116,596 |
| 2016 | $1,911 | $136,277 | $24,208 | $112,069 |
| 2015 | $1,871 | $134,231 | $23,845 | $110,386 |
| 2014 | $1,858 | $131,602 | $23,378 | $108,224 |
Source: Public Records
Map
Nearby Homes
- 2551 E Larkwood St
- 918 S Coral Tree Dr
- 920 S Spring Meadow Dr
- 2828 Far View Ln
- 1103 Novarro St
- 512 S Barranca St
- 2516 E Walnut Creek Pkwy
- 2407 E Walnut Creek Pkwy
- 2147 E Rio Verde Dr
- 213 S Meadow Rd
- 2829 Countrywood Ln
- 1021 S Lolita St
- 859 S Hillward Ave
- 631 S Hillward Ave
- 130 S Barranca St Unit 302
- 3258 E Whitebirch Dr
- 3050 Sunrise Rd
- 910 S Donna Beth Ave
- 1346 S South Hills Dr
- 417 S Charvers Ave
- 2610 E Cameron Ave
- 816 S Citrus St
- 2618 E Cameron Ave
- 822 S Citrus St
- 2605 E Cameron Ave
- 2613 E Cameron Ave
- 2544 E Cameron Ave
- 2549 E Cameron Ave
- 2626 E Cameron Ave
- 2621 E Cameron Ave
- 830 S Citrus St
- 2604 E Charlinda St
- 2629 E Cameron Ave
- 735 S Citrus St
- 2612 E Charlinda St
- 2634 E Cameron Ave
- 2548 E Eddes St
- 838 S Citrus St
- 2530 E Cameron Ave
- 2620 E Charlinda St