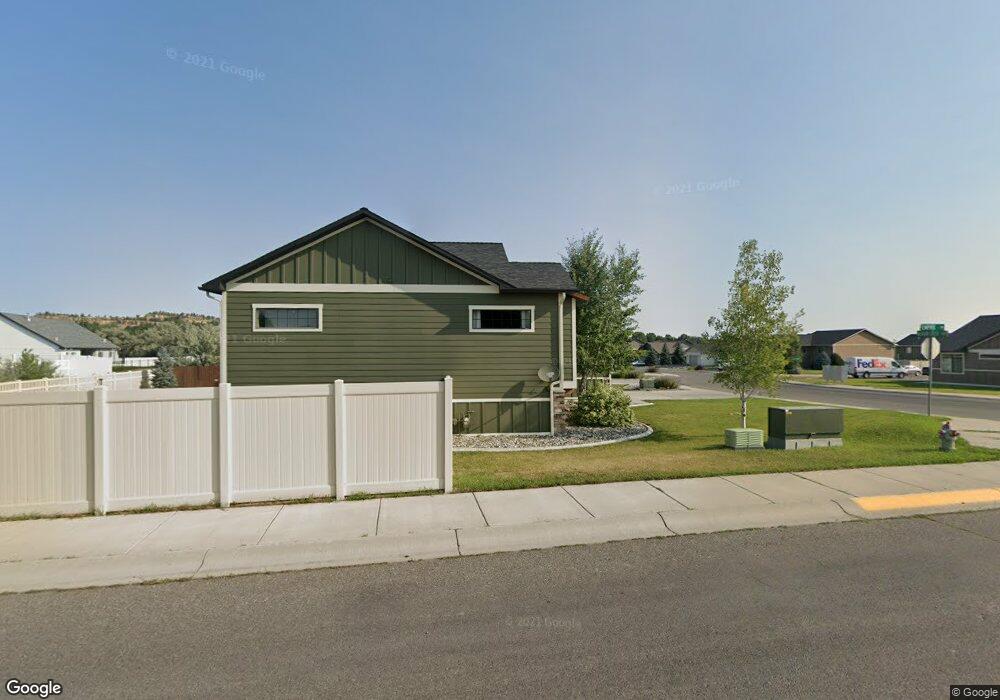
2602 Meadow Creek Loop Billings, MT 59105
Billings Heights NeighborhoodEstimated Value: $477,000 - $617,000
5
Beds
3
Baths
3,048
Sq Ft
$173/Sq Ft
Est. Value
About This Home
This home is located at 2602 Meadow Creek Loop, Billings, MT 59105 and is currently estimated at $526,690, approximately $172 per square foot. 2602 Meadow Creek Loop is a home with nearby schools including Beartooth School, Medicine Crow Middle School, and Skyview High School.
Ownership History
Date
Name
Owned For
Owner Type
Purchase Details
Closed on
Oct 19, 2021
Sold by
Dickey Jeremy Wade
Bought by
Vasile Manny A
Current Estimated Value
Home Financials for this Owner
Home Financials are based on the most recent Mortgage that was taken out on this home.
Original Mortgage
$438,900
Outstanding Balance
$400,236
Interest Rate
2.8%
Mortgage Type
New Conventional
Estimated Equity
$126,454
Purchase Details
Closed on
Aug 1, 2013
Sold by
Hanser Construction Co
Bought by
Mollman Amy and Stierna Cheryl A
Home Financials for this Owner
Home Financials are based on the most recent Mortgage that was taken out on this home.
Original Mortgage
$179,900
Interest Rate
3.92%
Mortgage Type
New Conventional
Purchase Details
Closed on
Jun 30, 2008
Sold by
Bcjm Properties Llc
Bought by
Hanser Capital Holdings Llc
Home Financials for this Owner
Home Financials are based on the most recent Mortgage that was taken out on this home.
Original Mortgage
$185,926
Interest Rate
3.92%
Mortgage Type
Purchase Money Mortgage
Create a Home Valuation Report for This Property
The Home Valuation Report is an in-depth analysis detailing your home's value as well as a comparison with similar homes in the area
Home Values in the Area
Average Home Value in this Area
Purchase History
| Date | Buyer | Sale Price | Title Company |
|---|---|---|---|
| Vasile Manny A | -- | Chicago Title | |
| Mollman Amy | -- | None Available | |
| Hanser Capital Holdings Llc | -- | None Available |
Source: Public Records
Mortgage History
| Date | Status | Borrower | Loan Amount |
|---|---|---|---|
| Open | Vasile Manny A | $438,900 | |
| Previous Owner | Mollman Amy | $179,900 | |
| Previous Owner | Hanser Capital Holdings Llc | $185,926 |
Source: Public Records
Tax History Compared to Growth
Tax History
| Year | Tax Paid | Tax Assessment Tax Assessment Total Assessment is a certain percentage of the fair market value that is determined by local assessors to be the total taxable value of land and additions on the property. | Land | Improvement |
|---|---|---|---|---|
| 2025 | $4,246 | $485,800 | $61,511 | $424,289 |
| 2024 | $4,246 | $446,600 | $58,165 | $388,435 |
| 2023 | $4,237 | $446,600 | $58,165 | $388,435 |
| 2022 | $3,647 | $336,300 | $51,241 | $285,059 |
| 2021 | $3,470 | $336,300 | $0 | $0 |
| 2020 | $3,426 | $316,500 | $0 | $0 |
| 2019 | $3,268 | $316,500 | $0 | $0 |
| 2018 | $3,396 | $324,200 | $0 | $0 |
| 2017 | $3,298 | $324,200 | $0 | $0 |
| 2016 | $2,937 | $290,600 | $0 | $0 |
| 2015 | $2,871 | $290,600 | $0 | $0 |
| 2014 | $2,545 | $136,316 | $0 | $0 |
Source: Public Records
Map
Nearby Homes
- 1526 Spring Gulch Way
- 2695 Strapper Ln
- 2689 Strapper Ln
- 2683 Strapper Ln
- 2677 Strapper Ln
- 2665 Strapper Ln
- 2647 Strapper Ln
- 2694 Strapper Ln
- 2688 Strapper Ln
- 2682 Strapper Ln
- 2670 Strapper Ln
- 2664 Strapper Ln
- 2658 Strapper Ln
- 1512 Mustang Valley Dr
- 1402 Eugene Way
- 1376 W Eugene Ave
- 1358 W Eugene Ave
- 1359 W Eugene Ave
- 1403 Eugene Ave
- 1374 Kelsey Ln
- 2602 Meadow Creek Dr
- 2604 Meadow Creek Loop
- 2604 Meadow Creek Dr
- 2606 Meadow Creek Dr
- 2529 Strapper Dr
- 2534 Meadow Creek Dr
- 2606 Meadow Creek Loop
- 2662 Meadow Creek Loop
- 2601 Strapper Trail
- 2601 Strapper Ln
- 2605 Strapper Ln
- 2530 Meadow Creek Dr
- 2608 Meadow Creek Loop
- 2541 Spring Gulch Way
- 2660 Meadow Creek Loop
- 2529 Strapper Ln
- 2609 Strapper Ln
- 2610 Meadow Creek Dr
- 2610 Meadow Creek Loop
- 2607 Meadow Creek Loop