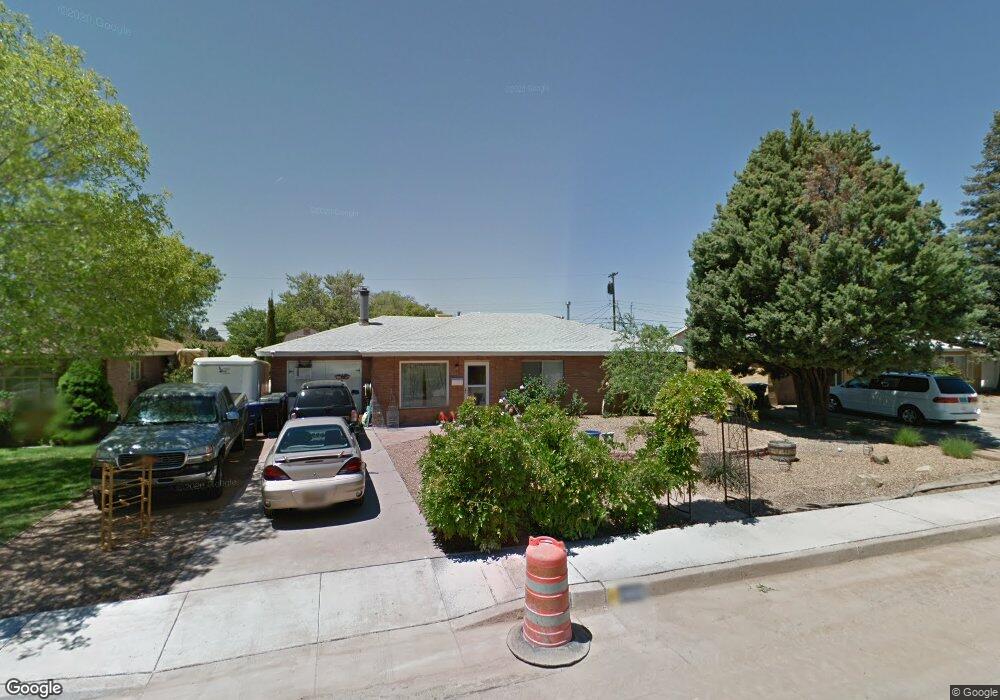
2603 General Bradley St NE Albuquerque, NM 87112
Northeast Heights NeighborhoodEstimated Value: $299,000 - $346,000
3
Beds
2
Baths
1,942
Sq Ft
$166/Sq Ft
Est. Value
About This Home
This home is located at 2603 General Bradley St NE, Albuquerque, NM 87112 and is currently estimated at $323,063, approximately $166 per square foot. 2603 General Bradley St NE is a home located in Bernalillo County with nearby schools including Sombra Del Monte Elementary School, Madison Middle School, and Sandia High School.
Ownership History
Date
Name
Owned For
Owner Type
Purchase Details
Closed on
Jan 11, 2010
Sold by
Welt Bethany M and Welt Raymond
Bought by
Whitling Leo C
Current Estimated Value
Home Financials for this Owner
Home Financials are based on the most recent Mortgage that was taken out on this home.
Original Mortgage
$120,100
Outstanding Balance
$77,771
Interest Rate
4.76%
Mortgage Type
New Conventional
Estimated Equity
$245,292
Purchase Details
Closed on
Oct 7, 2006
Sold by
Whitling Leo C and Mcdonald Bethany M
Bought by
Whitling Leo C and Whitling Bethany M
Purchase Details
Closed on
Sep 27, 2001
Sold by
Whitling Leo C
Bought by
Whitling Leo C and Mcdonald James H
Home Financials for this Owner
Home Financials are based on the most recent Mortgage that was taken out on this home.
Original Mortgage
$90,500
Interest Rate
6.88%
Create a Home Valuation Report for This Property
The Home Valuation Report is an in-depth analysis detailing your home's value as well as a comparison with similar homes in the area
Home Values in the Area
Average Home Value in this Area
Purchase History
| Date | Buyer | Sale Price | Title Company |
|---|---|---|---|
| Whitling Leo C | -- | Stewart Title | |
| Whitling Leo C | -- | Stewart Title | |
| Whitling Leo C | -- | Stewart Title | |
| Whitling Leo C | -- | Stewart Title |
Source: Public Records
Mortgage History
| Date | Status | Borrower | Loan Amount |
|---|---|---|---|
| Open | Whitling Leo C | $120,100 | |
| Previous Owner | Whitling Leo C | $90,500 | |
| Closed | Whitling Leo C | $0 |
Source: Public Records
Tax History Compared to Growth
Tax History
| Year | Tax Paid | Tax Assessment Tax Assessment Total Assessment is a certain percentage of the fair market value that is determined by local assessors to be the total taxable value of land and additions on the property. | Land | Improvement |
|---|---|---|---|---|
| 2025 | $2,249 | $56,958 | $17,558 | $39,400 |
| 2024 | $2,249 | $55,299 | $17,047 | $38,252 |
| 2023 | $2,209 | $53,689 | $16,551 | $37,138 |
| 2022 | $2,132 | $52,126 | $16,069 | $36,057 |
| 2021 | $2,058 | $50,608 | $15,601 | $35,007 |
| 2020 | $2,022 | $49,133 | $15,146 | $33,987 |
| 2019 | $1,960 | $47,703 | $14,706 | $32,997 |
| 2018 | $1,888 | $47,703 | $14,706 | $32,997 |
| 2017 | $1,827 | $46,313 | $14,277 | $32,036 |
| 2016 | $1,772 | $43,656 | $13,458 | $30,198 |
| 2015 | $42,384 | $42,384 | $13,066 | $29,318 |
| 2014 | $1,662 | $41,150 | $12,686 | $28,464 |
| 2013 | -- | $39,952 | $12,316 | $27,636 |
Source: Public Records
Map
Nearby Homes
- 8902 Claremont Ave NE
- 8922 Claremont Ave NE
- 3010 General Chennault St NE
- 8623 Menaul Blvd NE
- 8901 Cottonwood Rd NE
- 8407 Aztec Rd NE
- 9004 Shoshone Rd NE
- 8312 Dellwood Rd NE
- 8205 Connecticut St NE
- 8213 Connecticut St NE
- 8221 Connecticut St NE
- 3101 Vermont St NE
- 2908 Pennsylvania St NE
- 2724 Pennsylvania St NE
- 2720 Pennsylvania St NE
- 2057 Virginia St NE
- 9206 Aztec Rd NE
- 8333 Comanche Rd NE Unit 2D
- 8333 Comanche Rd NE Unit 16-D
- 8333 Comanche Rd NE Unit 10B
- 2531 General Bradley St NE
- 2607 General Bradley St NE
- 2602 General Marshall St NE
- 2530 General Marshall St NE
- 2611 General Bradley St NE
- 2606 General Marshall St NE
- 2526 General Marshall St NE
- 2606 General Bradley St NE
- 2602 General Bradley St NE
- 2530 General Bradley St NE
- 2610 General Marshall St NE
- 2523 General Bradley St NE
- 2615 General Bradley St NE
- 2522 General Marshall St NE
- 2610 General Bradley St NE
- 2614 General Marshall St NE
- 2522 General Bradley St NE
- 2519 General Bradley St NE
- 2518 General Marshall St NE
- 2603 General Marshall St NE