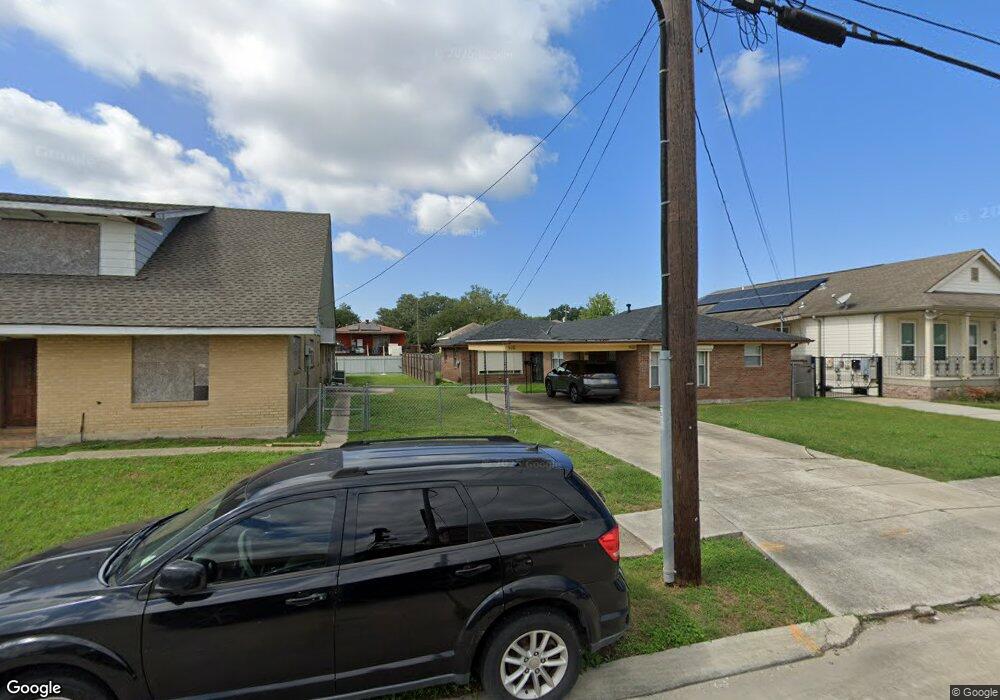
2604 06 Pauger St New Orleans, LA 70116
7th Ward NeighborhoodEstimated Value: $130,000 - $270,000
4
Beds
2
Baths
1,684
Sq Ft
$134/Sq Ft
Est. Value
About This Home
This home is located at 2604 06 Pauger St, New Orleans, LA 70116 and is currently estimated at $226,026, approximately $134 per square foot. 2604 06 Pauger St is a home located in Orleans Parish with nearby schools including Homer Plessy French Quarter Community School, Mary Bethune Elementary School, and KIPP Leadership Primary.
Ownership History
Date
Name
Owned For
Owner Type
Purchase Details
Closed on
Jan 10, 2022
Sold by
Cc Futures Llc
Bought by
Jcg Investments Llc
Current Estimated Value
Home Financials for this Owner
Home Financials are based on the most recent Mortgage that was taken out on this home.
Original Mortgage
$153,720
Outstanding Balance
$141,561
Interest Rate
3.05%
Mortgage Type
Commercial
Estimated Equity
$84,465
Purchase Details
Closed on
Jan 26, 2016
Sold by
Gusman Sheriff Marlin N and Armour Channing
Bought by
Nationstar Mortgage Llc
Purchase Details
Closed on
Jan 12, 2016
Sold by
Nationstar Mortgage Llc
Bought by
Secretary Of Housing And Urban Developme
Purchase Details
Closed on
Jan 4, 2008
Sold by
Jones Susie
Bought by
Armour Channing
Create a Home Valuation Report for This Property
The Home Valuation Report is an in-depth analysis detailing your home's value as well as a comparison with similar homes in the area
Home Values in the Area
Average Home Value in this Area
Purchase History
| Date | Buyer | Sale Price | Title Company |
|---|---|---|---|
| Jcg Investments Llc | $135,000 | Crescent Title Llc | |
| Nationstar Mortgage Llc | $55,000 | None Available | |
| Secretary Of Housing And Urban Developme | -- | None Available | |
| Armour Channing | $30,000 | -- |
Source: Public Records
Mortgage History
| Date | Status | Borrower | Loan Amount |
|---|---|---|---|
| Open | Jcg Investments Llc | $153,720 |
Source: Public Records
Tax History Compared to Growth
Tax History
| Year | Tax Paid | Tax Assessment Tax Assessment Total Assessment is a certain percentage of the fair market value that is determined by local assessors to be the total taxable value of land and additions on the property. | Land | Improvement |
|---|---|---|---|---|
| 2025 | $3,012 | $22,820 | $2,430 | $20,390 |
| 2024 | $2,484 | $18,540 | $2,430 | $16,110 |
| 2023 | $961 | $11,510 | $1,210 | $10,300 |
| 2022 | $961 | $6,830 | $1,210 | $5,620 |
| 2021 | $1,026 | $7,130 | $1,210 | $5,920 |
| 2020 | $1,037 | $7,130 | $1,210 | $5,920 |
| 2019 | $1,077 | $7,130 | $1,210 | $5,920 |
| 2018 | $1,099 | $7,130 | $1,210 | $5,920 |
| 2017 | $1,049 | $7,130 | $1,210 | $5,920 |
| 2016 | $1,082 | $7,130 | $1,210 | $5,920 |
| 2015 | $446 | $3,000 | $610 | $2,390 |
| 2014 | -- | $3,000 | $610 | $2,390 |
| 2013 | -- | $3,000 | $610 | $2,390 |
Source: Public Records
Map
Nearby Homes
- 2604 Pauger St
- 1826 Touro St
- 1818 Saint Anthony St
- 1870 72 N Roman St
- 2033 Saint Anthony St
- 1931 Annette St
- 1904 Frenchmen St
- 1733 Touro St
- 1727 19 Touro St
- 1922 N Galvez St
- 2102 Saint Anthony St
- 1719 Touro St
- 2008 10 Frenchmen St
- 1827 29 Frenchmen St
- 1931 Frenchmen St
- 1724 Frenchmen St
- 2326 Pauger St
- 1626 Saint Anthony St
- 2132 Touro St
- 2905 Pauger St
- 2604 Pauger St Unit 6
- 2600 Pauger St
- 2606 Pauger St
- 2604 Pauger St
- 2610 Pauger St
- 2612 Pauger St
- 1969 N Prieur St
- 2542 Pauger St
- 2616 Pauger St
- 2540 Pauger St
- 1963 N Prieur St
- 2601 Pauger St
- 2620-20 Paauger St
- 2620 Pauger St
- 2536 Pauger St
- 1961 N Prieur St
- 2609 Pauger St
- 1966 N Prieur St
- 2620 20 Paauger St
- 2532 Pauger St