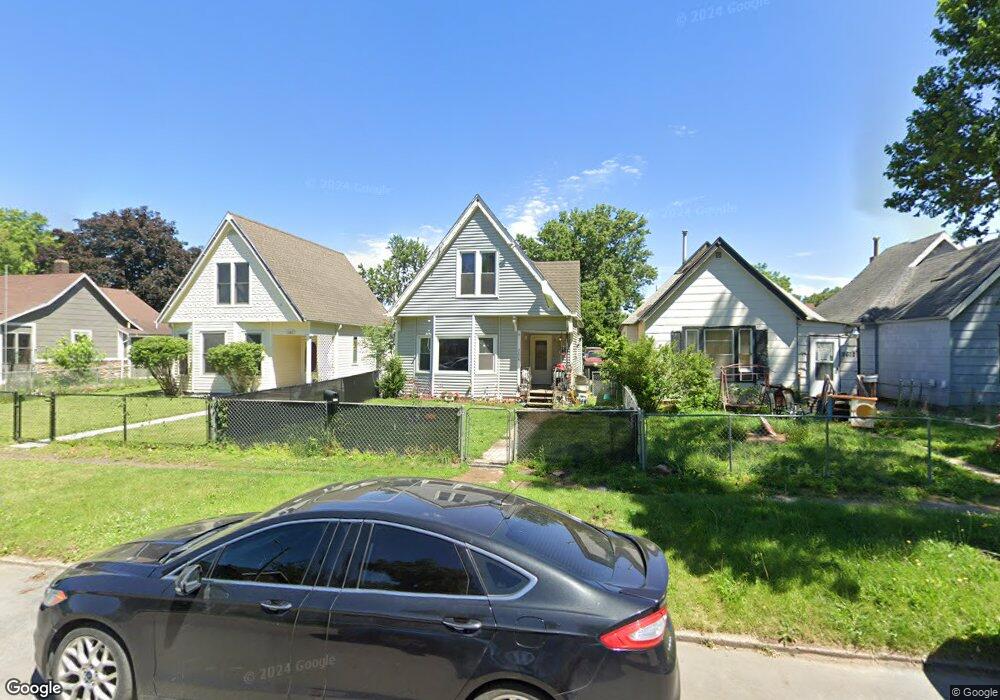
2604 E Walnut St Des Moines, IA 50317
Fairground NeighborhoodEstimated Value: $112,000 - $176,000
2
Beds
1
Bath
931
Sq Ft
$160/Sq Ft
Est. Value
About This Home
This home is located at 2604 E Walnut St, Des Moines, IA 50317 and is currently estimated at $148,595, approximately $159 per square foot. 2604 E Walnut St is a home located in Polk County with nearby schools including Capitol View Elementary School, Hiatt Middle School, and East High School.
Ownership History
Date
Name
Owned For
Owner Type
Purchase Details
Closed on
Sep 26, 2008
Sold by
Hud
Bought by
Skinner Kyle
Current Estimated Value
Purchase Details
Closed on
Nov 13, 2007
Sold by
Us Bank Na
Bought by
Hud
Purchase Details
Closed on
Jun 24, 2005
Sold by
West Katherine M
Bought by
Fuqua Todd and Fuqua Stacey
Home Financials for this Owner
Home Financials are based on the most recent Mortgage that was taken out on this home.
Original Mortgage
$83,686
Interest Rate
5.86%
Mortgage Type
FHA
Purchase Details
Closed on
Oct 23, 2000
Sold by
Decarlo Patrick J and Decarlo Kathleen N
Bought by
Cole Heather L and Cole Jason E
Home Financials for this Owner
Home Financials are based on the most recent Mortgage that was taken out on this home.
Original Mortgage
$62,700
Interest Rate
7.9%
Create a Home Valuation Report for This Property
The Home Valuation Report is an in-depth analysis detailing your home's value as well as a comparison with similar homes in the area
Home Values in the Area
Average Home Value in this Area
Purchase History
| Date | Buyer | Sale Price | Title Company |
|---|---|---|---|
| Skinner Kyle | -- | None Available | |
| Hud | -- | None Available | |
| Fuqua Todd | $84,500 | -- | |
| Cole Heather L | $49,500 | -- |
Source: Public Records
Mortgage History
| Date | Status | Borrower | Loan Amount |
|---|---|---|---|
| Previous Owner | Fuqua Todd | $83,686 | |
| Previous Owner | Cole Heather L | $62,700 |
Source: Public Records
Tax History
| Year | Tax Paid | Tax Assessment Tax Assessment Total Assessment is a certain percentage of the fair market value that is determined by local assessors to be the total taxable value of land and additions on the property. | Land | Improvement |
|---|---|---|---|---|
| 2025 | $1,860 | $122,500 | $17,700 | $104,800 |
| 2024 | $1,860 | $105,000 | $15,100 | $89,900 |
| 2023 | $1,716 | $105,000 | $15,100 | $89,900 |
| 2022 | $1,702 | $81,700 | $12,300 | $69,400 |
| 2021 | $1,562 | $81,700 | $12,300 | $69,400 |
| 2020 | $1,618 | $71,200 | $10,800 | $60,400 |
| 2019 | $1,424 | $71,200 | $10,800 | $60,400 |
| 2018 | $1,404 | $61,500 | $9,300 | $52,200 |
| 2017 | $1,572 | $61,500 | $9,300 | $52,200 |
| 2016 | $1,532 | $58,100 | $8,700 | $49,400 |
| 2015 | $1,532 | $58,100 | $8,700 | $49,400 |
| 2014 | $1,510 | $56,800 | $8,400 | $48,400 |
Source: Public Records
Map
Nearby Homes
- 2540 Capitol Ave
- 2540 Logan Ave
- 2524 E Walnut St
- 2638 E Grand Ave
- 2715 Logan Ave
- 2433 E Walnut St
- 2515 Des Moines St
- 2441 E Grand Ave
- 2743 Des Moines St
- 2406 Logan Ave
- 2736 Des Moines St
- 2805 Des Moines St
- 2814 Des Moines St
- 2343 E Grand Ave
- 818 E 25th Ct
- 2334 Des Moines St
- 815 E 25th St
- 2907 Des Moines St
- 2311 Des Moines St
- 2825 Maple St
- 2612 E Walnut St
- 2602 E Walnut St
- 2616 E Walnut St
- 2600 E Walnut St
- 2618 E Walnut St
- 2607 Capitol Ave
- 2620 E Walnut St
- 2611 Capitol Ave
- 2601 Capitol Ave
- 2548 E Walnut St
- 2613 Capitol Ave
- 2605 E Walnut St
- 2611 E Walnut St
- 2622 E Walnut St
- 2601 E Walnut St
- 2613 E Walnut St
- 2619 Capitol Ave
- 2615 E Walnut St
- 2617 E Walnut St
- 2624 E Walnut St
Your Personal Tour Guide
Ask me questions while you tour the home.