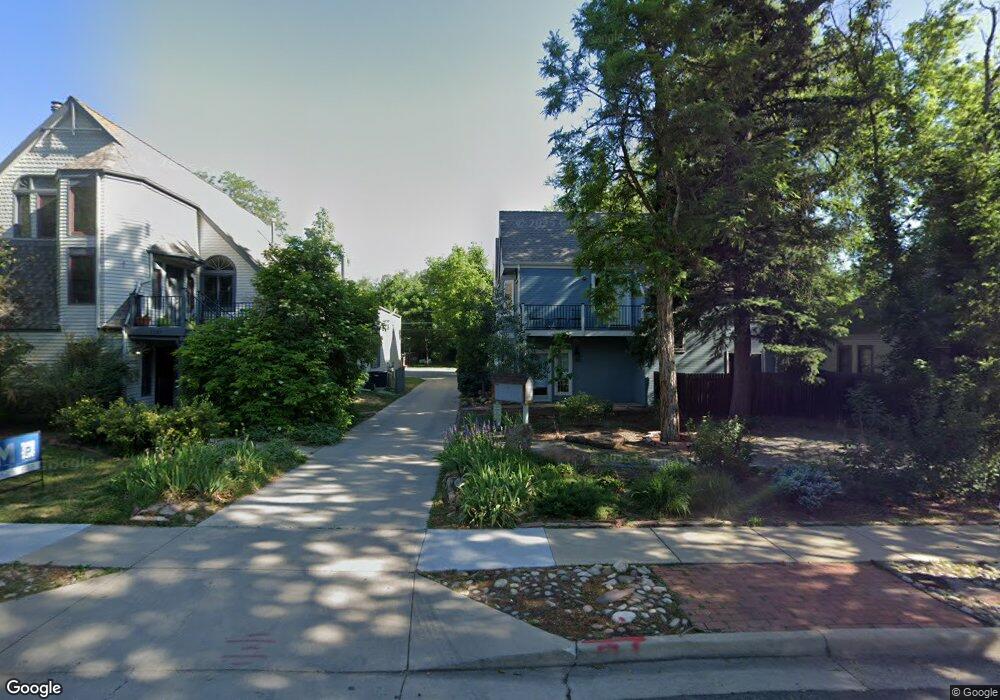
2605 Mapleton Ave Unit 2605 Boulder, CO 80304
Whittier NeighborhoodEstimated Value: $549,000 - $744,000
2
Beds
2
Baths
1,184
Sq Ft
$556/Sq Ft
Est. Value
About This Home
This home is located at 2605 Mapleton Ave Unit 2605, Boulder, CO 80304 and is currently estimated at $658,052, approximately $555 per square foot. 2605 Mapleton Ave Unit 2605 is a home located in Boulder County with nearby schools including Whittier Elementary School, Casey Middle School, and Boulder High School.
Ownership History
Date
Name
Owned For
Owner Type
Purchase Details
Closed on
Feb 24, 2006
Sold by
Norton Nancy V and Pawlowski Margaret Ann
Bought by
King Erin Jessica
Current Estimated Value
Home Financials for this Owner
Home Financials are based on the most recent Mortgage that was taken out on this home.
Original Mortgage
$244,000
Outstanding Balance
$131,312
Interest Rate
5.75%
Mortgage Type
Purchase Money Mortgage
Estimated Equity
$526,740
Purchase Details
Closed on
Sep 13, 2000
Sold by
Norton Nancy V and Norton Nancy
Bought by
Norton Nancy
Purchase Details
Closed on
Dec 10, 1993
Sold by
Hoover Nancy V
Bought by
Norton Nancy
Home Financials for this Owner
Home Financials are based on the most recent Mortgage that was taken out on this home.
Original Mortgage
$65,600
Interest Rate
7.06%
Purchase Details
Closed on
Oct 10, 1991
Bought by
Ross Robert James
Purchase Details
Closed on
Nov 5, 1990
Bought by
Ross Robert James
Create a Home Valuation Report for This Property
The Home Valuation Report is an in-depth analysis detailing your home's value as well as a comparison with similar homes in the area
Home Values in the Area
Average Home Value in this Area
Purchase History
| Date | Buyer | Sale Price | Title Company |
|---|---|---|---|
| King Erin Jessica | $305,000 | Fahtco | |
| Norton Nancy | -- | -- | |
| Norton Nancy | -- | -- | |
| Ross Robert James | $79,500 | -- | |
| Ross Robert James | $65,000 | -- |
Source: Public Records
Mortgage History
| Date | Status | Borrower | Loan Amount |
|---|---|---|---|
| Open | King Erin Jessica | $244,000 | |
| Previous Owner | Norton Nancy | $65,600 |
Source: Public Records
Tax History
| Year | Tax Paid | Tax Assessment Tax Assessment Total Assessment is a certain percentage of the fair market value that is determined by local assessors to be the total taxable value of land and additions on the property. | Land | Improvement |
|---|---|---|---|---|
| 2025 | $4,055 | $47,969 | -- | $47,969 |
| 2024 | $4,055 | $47,969 | -- | $47,969 |
| 2023 | $4,868 | $45,248 | -- | $48,933 |
| 2022 | $5,062 | $43,667 | $0 | $43,667 |
| 2021 | $4,893 | $44,923 | $0 | $44,923 |
| 2020 | $4,632 | $42,292 | $0 | $42,292 |
| 2019 | $4,557 | $42,292 | $0 | $42,292 |
| 2018 | $4,303 | $38,880 | $0 | $38,880 |
| 2017 | $4,197 | $45,428 | $0 | $45,428 |
| 2016 | $3,733 | $32,357 | $0 | $32,357 |
| 2015 | $3,584 | $25,074 | $0 | $25,074 |
| 2014 | $3,040 | $25,074 | $0 | $25,074 |
Source: Public Records
Map
Nearby Homes
- 2515 Bluff St
- 2711 Mapleton Ave Unit 9
- 2718 Pine St Unit 301
- 2120 Folsom St
- 2727 Folsom St Unit 303
- 2727 Folsom St Unit 218
- 2340 Panorama Ave
- 2240 Bluff St
- 2530 28th St Unit 118
- 2336 Spruce St Unit E
- 2991 25th St
- 1894 Folsom St
- 2253 Spruce St Unit 2
- 2475 Walnut St
- 2901 Lorraine Ct
- 1916 23rd St Unit 6
- 2085 Balsam Dr
- 2201 Pearl St Unit 224
- 2707 Valmont Rd Unit D-304
- 2707 Valmont Rd Unit 312D
- 2583 Mapleton Ave Unit 2583
- 2603 Mapleton Ave Unit 2603
- 2579 Mapleton Ave Unit 2579
- 2607 Mapleton Ave Unit 2607
- 2607 Mapleton Ave Unit O
- 2581 Mapleton Ave Unit 2581
- 2575 Mapleton Ave
- 2611 Mapleton Ave
- 2571 Mapleton Ave
- 2615 Mapleton Ave
- 2551 Mapleton Ave
- 2625 Mapleton Ave
- 2604 Mapleton Ave
- 2576 Mapleton Ave
- 2614 Mapleton Ave
- 2537 Mapleton Ave Unit C
- 2537 Mapleton Ave Unit B
- 2537 Mapleton Ave Unit A
- 2370 Folsom St Unit C
- 2370 Folsom St Unit B
Your Personal Tour Guide
Ask me questions while you tour the home.