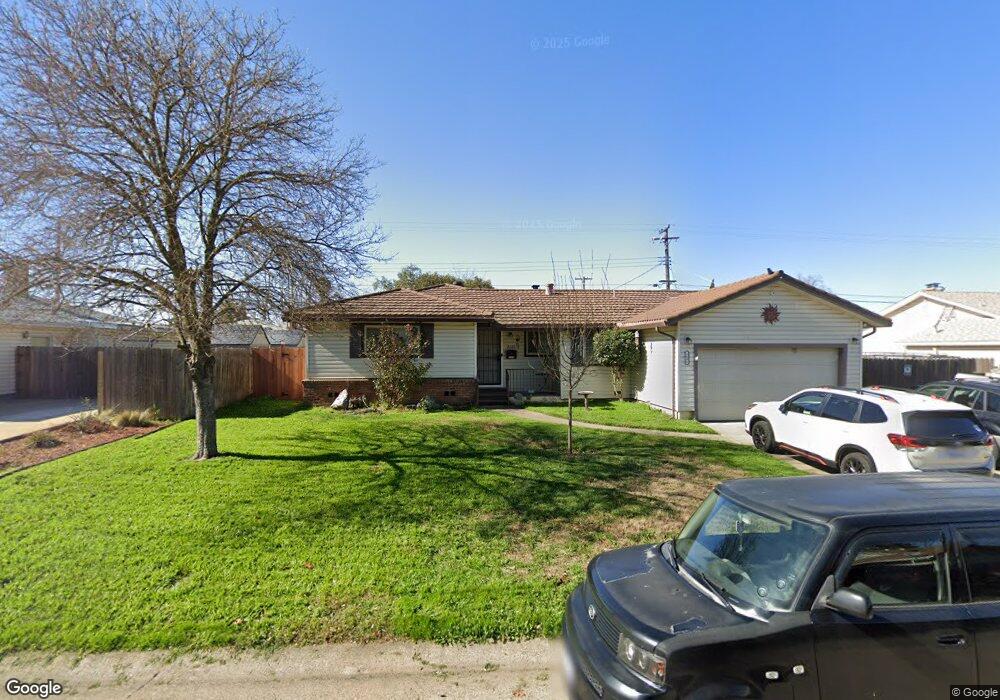
2606 Cabernet Way Rancho Cordova, CA 95670
Cordova Lane NeighborhoodEstimated Value: $363,000 - $472,000
3
Beds
2
Baths
1,448
Sq Ft
$303/Sq Ft
Est. Value
About This Home
This home is located at 2606 Cabernet Way, Rancho Cordova, CA 95670 and is currently estimated at $438,316, approximately $302 per square foot. 2606 Cabernet Way is a home located in Sacramento County with nearby schools including Rancho Cordova Elementary School, W.E. Mitchell Middle School, and Cordova High School.
Ownership History
Date
Name
Owned For
Owner Type
Purchase Details
Closed on
Feb 13, 2008
Sold by
The Bank Of New York
Bought by
Brokaw John and Brokaw Stephanie
Current Estimated Value
Home Financials for this Owner
Home Financials are based on the most recent Mortgage that was taken out on this home.
Original Mortgage
$210,890
Outstanding Balance
$128,434
Interest Rate
5.41%
Mortgage Type
FHA
Estimated Equity
$309,882
Purchase Details
Closed on
Dec 3, 2007
Sold by
Chavez Jose
Bought by
The Bank Of New York and Ge Wmc Asset Backed Pass Through Certifi
Purchase Details
Closed on
Oct 28, 2005
Sold by
Hogan Dennis J and Hogan Kevin J
Bought by
Chavez Jose
Home Financials for this Owner
Home Financials are based on the most recent Mortgage that was taken out on this home.
Original Mortgage
$291,960
Interest Rate
6.87%
Mortgage Type
Balloon
Create a Home Valuation Report for This Property
The Home Valuation Report is an in-depth analysis detailing your home's value as well as a comparison with similar homes in the area
Home Values in the Area
Average Home Value in this Area
Purchase History
| Date | Buyer | Sale Price | Title Company |
|---|---|---|---|
| Brokaw John | $214,500 | Lawyers Title Company | |
| The Bank Of New York | $234,000 | None Available | |
| Chavez Jose | $365,000 | Chicago Title Co |
Source: Public Records
Mortgage History
| Date | Status | Borrower | Loan Amount |
|---|---|---|---|
| Open | Brokaw John | $210,890 | |
| Previous Owner | Chavez Jose | $291,960 |
Source: Public Records
Tax History Compared to Growth
Tax History
| Year | Tax Paid | Tax Assessment Tax Assessment Total Assessment is a certain percentage of the fair market value that is determined by local assessors to be the total taxable value of land and additions on the property. | Land | Improvement |
|---|---|---|---|---|
| 2025 | $5,242 | $281,338 | $138,567 | $142,771 |
| 2024 | $5,242 | $275,822 | $135,850 | $139,972 |
| 2023 | $4,904 | $270,415 | $133,187 | $137,228 |
| 2022 | $4,524 | $265,114 | $130,576 | $134,538 |
| 2021 | $4,735 | $259,916 | $128,016 | $131,900 |
| 2020 | $4,624 | $257,252 | $126,704 | $130,548 |
| 2019 | $4,136 | $252,209 | $124,220 | $127,989 |
| 2018 | $3,828 | $247,265 | $121,785 | $125,480 |
| 2017 | $3,750 | $242,418 | $119,398 | $123,020 |
| 2016 | $2,884 | $237,665 | $117,057 | $120,608 |
| 2015 | $3,645 | $234,096 | $115,299 | $118,797 |
| 2014 | $3,277 | $216,024 | $106,398 | $109,626 |
Source: Public Records
Map
Nearby Homes
- 2701 Zinfandel Dr
- 2413 Cordova Ln
- 2746 Aramon Dr
- 2344 Rudat Cir
- 10825 Walnutwood Way
- 10583 Home Ranch Ct
- 10810 Paiute Way
- 2404 Coolidge Way
- 2724 Zinfandel Dr
- 2329 Mcgregor Dr
- 2352 Sonata Dr
- 10465 Rugby Ct
- 2644 Tronero Way
- 2129 Danbury Way
- 2266 River Trails Cir
- 10361 Daniel Way
- 2171 River Vista Way
- 2337 Benita Dr
- 2600 Garrett Way
- 10470 Spaulding Way
- 2600 Cabernet Way
- 2610 Cabernet Way
- 2605 Zinfandel Dr
- 2609 Zinfandel Dr
- 2601 Zinfandel Dr
- 2605 Cabernet Way
- 2609 Cabernet Way
- 2614 Cabernet Way
- 2601 Cabernet Way
- 2540 Cabernet Way
- 2561 Zinfandel Dr
- 2539 Cabernet Way
- 2617 Zinfandel Dr
- 2620 Cabernet Way
- 2617 Cabernet Way
- 2604 Riesling Way
- 2608 Riesling Way
- 2536 Cabernet Way
- 2600 Riesling Way
- 2612 Riesling Way