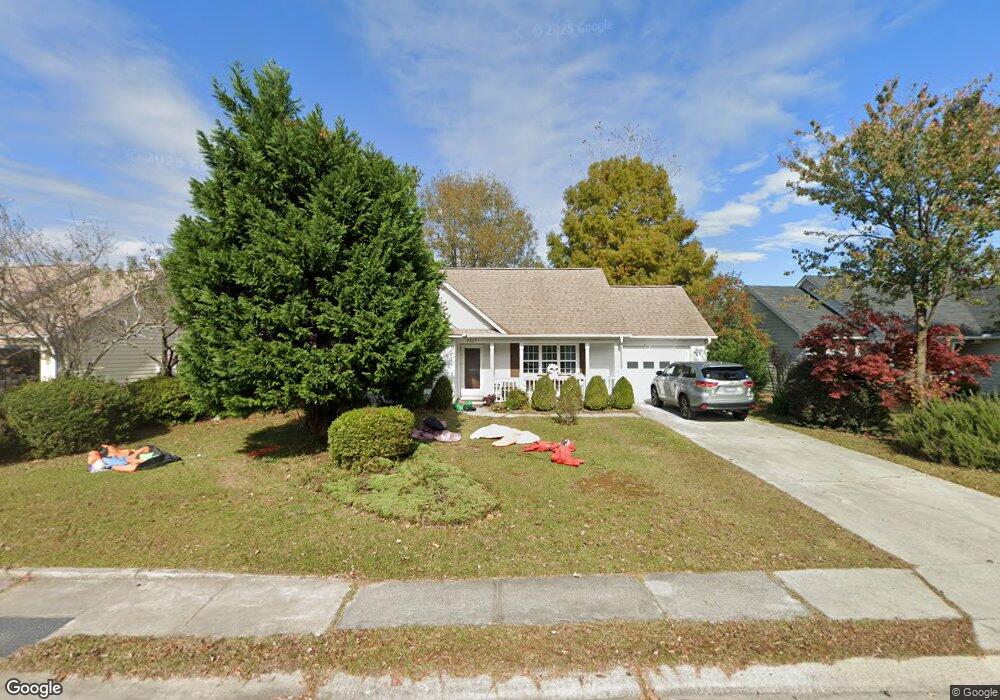
2607 Sapling Cir Wilmington, NC 28411
Estimated Value: $325,759 - $356,000
3
Beds
2
Baths
1,247
Sq Ft
$276/Sq Ft
Est. Value
About This Home
This home is located at 2607 Sapling Cir, Wilmington, NC 28411 and is currently estimated at $343,690, approximately $275 per square foot. 2607 Sapling Cir is a home located in New Hanover County with nearby schools including John J. Blair Elementary School, Emma B. Trask Middle School, and Emsley A. Laney High School.
Ownership History
Date
Name
Owned For
Owner Type
Purchase Details
Closed on
Nov 17, 2025
Sold by
Cwiklinski Brian and Cwiklinski Robert Brian
Bought by
Cwiklinski Robert Brian and Cwiklinski Heather
Current Estimated Value
Home Financials for this Owner
Home Financials are based on the most recent Mortgage that was taken out on this home.
Original Mortgage
$231,000
Outstanding Balance
$231,000
Interest Rate
6.3%
Mortgage Type
New Conventional
Estimated Equity
$112,690
Purchase Details
Closed on
Jul 30, 2007
Sold by
Hayes Betty H
Bought by
Cwiklinski Brian and Cwiklinski Heather
Home Financials for this Owner
Home Financials are based on the most recent Mortgage that was taken out on this home.
Original Mortgage
$186,030
Interest Rate
6.71%
Mortgage Type
FHA
Purchase Details
Closed on
Jul 2, 1996
Sold by
Landmark Homes Inc
Bought by
Hayes Betty H
Purchase Details
Closed on
May 7, 1996
Sold by
Landmark Developers Inc
Bought by
Landmark Homes Inc
Purchase Details
Closed on
Mar 12, 1993
Sold by
Gps Inc
Bought by
Landmark Developers Inc
Purchase Details
Closed on
Mar 8, 1993
Sold by
Landmark Organization Inc
Bought by
Gps Inc
Purchase Details
Closed on
Sep 9, 1992
Sold by
Huffine David E
Bought by
Landmark Organization Inc
Create a Home Valuation Report for This Property
The Home Valuation Report is an in-depth analysis detailing your home's value as well as a comparison with similar homes in the area
Home Values in the Area
Average Home Value in this Area
Purchase History
| Date | Buyer | Sale Price | Title Company |
|---|---|---|---|
| Cwiklinski Robert Brian | -- | Equity First Title | |
| Cwiklinski Brian | $187,500 | None Available | |
| Hayes Betty H | $110,000 | -- | |
| Landmark Homes Inc | -- | -- | |
| Landmark Developers Inc | -- | -- | |
| Gps Inc | $6,775,000 | -- | |
| Landmark Organization Inc | $300,000 | -- |
Source: Public Records
Mortgage History
| Date | Status | Borrower | Loan Amount |
|---|---|---|---|
| Open | Cwiklinski Robert Brian | $231,000 | |
| Previous Owner | Cwiklinski Brian | $186,030 |
Source: Public Records
Tax History Compared to Growth
Tax History
| Year | Tax Paid | Tax Assessment Tax Assessment Total Assessment is a certain percentage of the fair market value that is determined by local assessors to be the total taxable value of land and additions on the property. | Land | Improvement |
|---|---|---|---|---|
| 2025 | $1,284 | $319,800 | $107,900 | $211,900 |
| 2023 | $1,165 | $208,900 | $59,300 | $149,600 |
| 2022 | $1,170 | $208,900 | $59,300 | $149,600 |
| 2021 | $1,156 | $208,900 | $59,300 | $149,600 |
| 2020 | $991 | $156,600 | $42,000 | $114,600 |
| 2019 | $991 | $156,600 | $42,000 | $114,600 |
| 2018 | $991 | $156,600 | $42,000 | $114,600 |
| 2017 | $1,014 | $156,600 | $42,000 | $114,600 |
| 2016 | $986 | $142,300 | $40,000 | $102,300 |
| 2015 | $916 | $142,300 | $40,000 | $102,300 |
| 2014 | $901 | $142,300 | $40,000 | $102,300 |
Source: Public Records
Map
Nearby Homes
- 2201 Ovalberry Ct
- 5332 Sun Coast Dr
- 2513 Sapling Cir
- 2401 Sapling Cir
- 2409 White Rd
- 7300 Farrington Farms Dr
- 1911 Daniel Boone Trail
- 6331 Gordon Rd
- 6329 Gordon Rd
- 807 Spy Glass Ct
- 814 Bay Blossom Dr
- 1915 Daniel Boone Trail
- 6723 Newbury Way
- 5000 Sun Coast Dr
- 7108 Thurgood Rd
- 402 Governors Rd
- 2616 Hastings Dr
- 7257 Savanna Run Loop
- 7226 Copperfield Ct
- 4905 Tupelo Dr
- 2603 Sapling Cir
- 2609 Sapling Cir
- 2203 Merklebay Ct
- 2203 Merklebay Ct
- 2205 Merklebay Ct
- 2611 Sapling Cir
- 2107 Sapling Ct
- 2109 Sapling Ct
- 2105 Sapling Ct
- 2608 Conifer Ct
- 2610 Sapling Cir
- 2602 Sapling Cir
- 2103 Sapling Ct
- 2612 Sapling Cir
- 2111 Sapling Cir
- 2615 Sapling Cir
- 2606 Conifer Ct
- 2604 Conifer Ct
- 2202 Merklebay Ct
- 2614 Sapling Cir