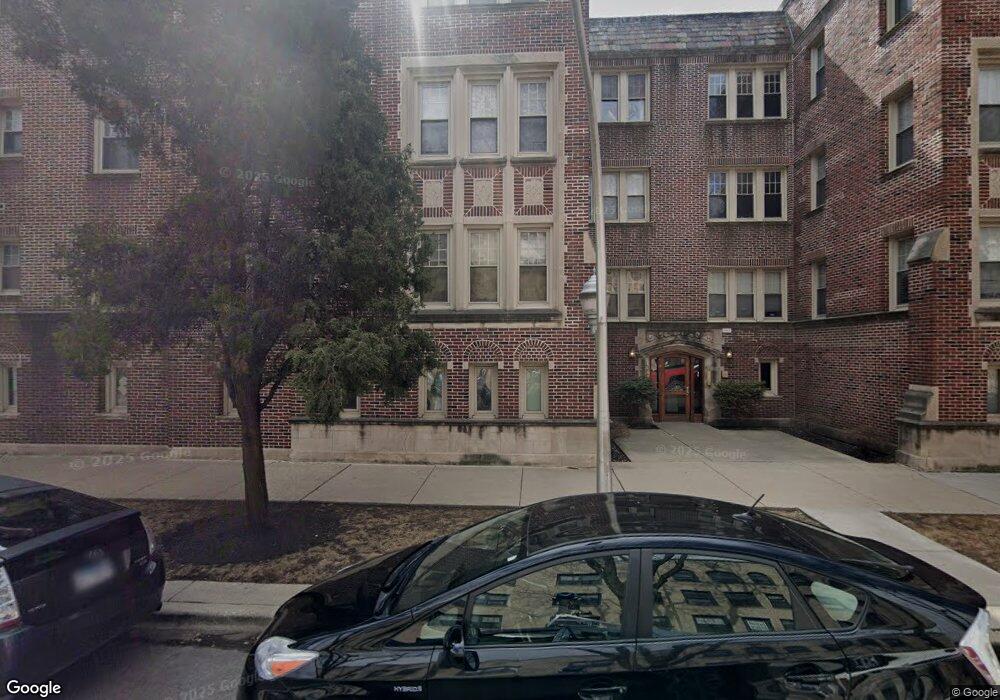
2607 W Rosemont Ave Unit 2607A Chicago, IL 60659
West Ridge NeighborhoodEstimated Value: $150,000 - $194,000
2
Beds
1
Bath
750
Sq Ft
$220/Sq Ft
Est. Value
About This Home
This home is located at 2607 W Rosemont Ave Unit 2607A, Chicago, IL 60659 and is currently estimated at $165,149, approximately $220 per square foot. 2607 W Rosemont Ave Unit 2607A is a home located in Cook County with nearby schools including Clinton Elementary School, Mather High School, and Bethesda International Academy.
Ownership History
Date
Name
Owned For
Owner Type
Purchase Details
Closed on
Jul 6, 2020
Sold by
Carmona Dennice and Vergara Diana
Bought by
Hulseman Conor and Hulseman Melita
Current Estimated Value
Home Financials for this Owner
Home Financials are based on the most recent Mortgage that was taken out on this home.
Original Mortgage
$96,800
Interest Rate
3.75%
Mortgage Type
New Conventional
Purchase Details
Closed on
Jun 4, 2010
Sold by
6200 N Rockwell Chicago Llc
Bought by
Carmona Dennice
Home Financials for this Owner
Home Financials are based on the most recent Mortgage that was taken out on this home.
Original Mortgage
$112,485
Interest Rate
5.5%
Mortgage Type
FHA
Purchase Details
Closed on
Sep 29, 2008
Sold by
Hinsdale Bank & Trust Co
Bought by
6200 N Rockwell Chicago Llc
Create a Home Valuation Report for This Property
The Home Valuation Report is an in-depth analysis detailing your home's value as well as a comparison with similar homes in the area
Home Values in the Area
Average Home Value in this Area
Purchase History
| Date | Buyer | Sale Price | Title Company |
|---|---|---|---|
| Hulseman Conor | $121,000 | Chicago Title | |
| Carmona Dennice | $114,000 | Cti | |
| 6200 N Rockwell Chicago Llc | $1,200,000 | Cti |
Source: Public Records
Mortgage History
| Date | Status | Borrower | Loan Amount |
|---|---|---|---|
| Previous Owner | Hulseman Conor | $96,800 | |
| Previous Owner | Carmona Dennice | $112,485 |
Source: Public Records
Tax History Compared to Growth
Tax History
| Year | Tax Paid | Tax Assessment Tax Assessment Total Assessment is a certain percentage of the fair market value that is determined by local assessors to be the total taxable value of land and additions on the property. | Land | Improvement |
|---|---|---|---|---|
| 2024 | $2,110 | $15,383 | $1,487 | $13,896 |
| 2023 | $2,057 | $10,000 | $1,206 | $8,794 |
| 2022 | $2,057 | $10,000 | $1,206 | $8,794 |
| 2021 | $2,011 | $9,999 | $1,205 | $8,794 |
| 2020 | $780 | $6,604 | $723 | $5,881 |
| 2019 | $801 | $7,416 | $723 | $6,693 |
| 2018 | $786 | $7,416 | $723 | $6,693 |
| 2017 | $742 | $6,820 | $643 | $6,177 |
| 2016 | $866 | $6,820 | $643 | $6,177 |
| 2015 | $769 | $6,820 | $643 | $6,177 |
| 2014 | $1,126 | $8,639 | $602 | $8,037 |
| 2013 | $1,609 | $11,477 | $602 | $10,875 |
Source: Public Records
Map
Nearby Homes
- 6345 N Washtenaw Ave Unit GW
- 6414 N Rockwell St
- 6418 N Rockwell St
- 6312 N Fairfield Ave Unit 3A
- 6312 N Fairfield Ave Unit 3B
- 6319 N Artesian Ave Unit 3W
- 6141 N Campbell Ave
- 2535 W Glenlake Ave
- 6141 N Artesian Ave
- 6235 N Mozart St
- 2707 W Glenlake Ave Unit 27073
- 6451 N California Ave Unit 2
- 6457 N California Ave Unit 3
- 6151 N Mozart St
- 6214 N Mozart St Unit 3E
- 2338 W Granville Ave Unit 2
- 2320 W Rosemont Ave Unit 1
- 6517 N California Ave Unit 303
- 6558 N Washtenaw Ave Unit 2
- 6246 N Oakley Ave
- 6256 N Rockwell St Unit C
- 6254 N Rockwell St Unit 3C
- 6254 N Rockwell St Unit G
- 2607 W Rosemont Ave Unit B
- 6254 N Rockwell St Unit 6254C
- 6254 N Rockwell St Unit 6254B
- 2609 W Rosemont Ave Unit 2609A
- 6254 N Rockwell St Unit 6254G
- 6256 N Rockwell St Unit 6256C
- 2609 W Rosemont Ave Unit 2609B
- 6254 N Rockwell St Unit 6254A
- 2611 W Rosemont Ave Unit 2611C
- 2611 W Rosemont Ave Unit 2611B
- 2611 W Rosemont Ave Unit 2611A
- 2607 W Rosemont Ave Unit 2607C
- 2607 W Rosemont Ave Unit 2607B
- 6256 N Rockwell St Unit 6256B
- 6256 N Rockwell St Unit 6256A
- 6256 N Rockwell St Unit B
- 6256 N Rockwell St Unit A