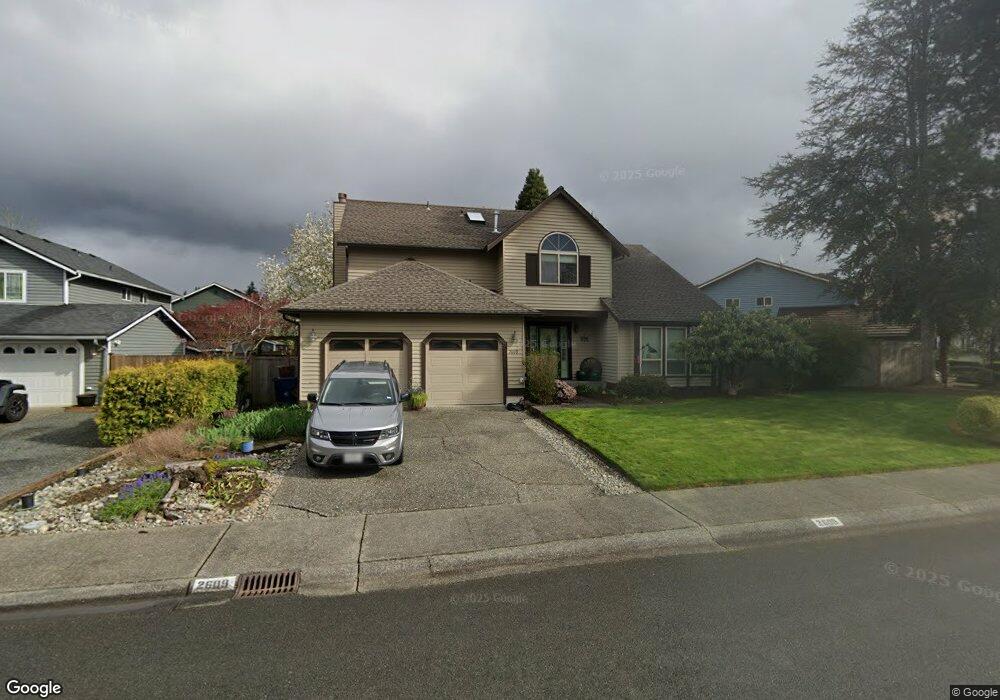
2609 183rd St SE Bothell, WA 98012
North Creek NeighborhoodEstimated Value: $992,000 - $1,175,000
4
Beds
3
Baths
2,431
Sq Ft
$449/Sq Ft
Est. Value
About This Home
This home is located at 2609 183rd St SE, Bothell, WA 98012 and is currently estimated at $1,092,679, approximately $449 per square foot. 2609 183rd St SE is a home located in Snohomish County with nearby schools including Fernwood Elementary School, Skyview Middle School, and North Creek High School.
Ownership History
Date
Name
Owned For
Owner Type
Purchase Details
Closed on
Jan 9, 2018
Sold by
Heusted Dennis C
Bought by
Heusted Karm P
Current Estimated Value
Purchase Details
Closed on
Dec 23, 1996
Sold by
Washington Mutual Bank
Bought by
Heusted Karin P and Heusted Dennis C
Home Financials for this Owner
Home Financials are based on the most recent Mortgage that was taken out on this home.
Original Mortgage
$182,250
Outstanding Balance
$12,420
Interest Rate
7.59%
Estimated Equity
$1,080,259
Purchase Details
Closed on
Jun 3, 1996
Sold by
Moore Michael A and Moore Ingrid E
Bought by
Washington Mutual Bank
Home Financials for this Owner
Home Financials are based on the most recent Mortgage that was taken out on this home.
Original Mortgage
$108,500
Interest Rate
8.01%
Mortgage Type
Seller Take Back
Create a Home Valuation Report for This Property
The Home Valuation Report is an in-depth analysis detailing your home's value as well as a comparison with similar homes in the area
Home Values in the Area
Average Home Value in this Area
Purchase History
| Date | Buyer | Sale Price | Title Company |
|---|---|---|---|
| Heusted Karm P | -- | None Available | |
| Heusted Karin P | $202,500 | Chicago Title Insurance Co | |
| Washington Mutual Bank | $180,905 | Chicago Title Ins Co |
Source: Public Records
Mortgage History
| Date | Status | Borrower | Loan Amount |
|---|---|---|---|
| Open | Heusted Karin P | $182,250 | |
| Previous Owner | Washington Mutual Bank | $108,500 |
Source: Public Records
Tax History
| Year | Tax Paid | Tax Assessment Tax Assessment Total Assessment is a certain percentage of the fair market value that is determined by local assessors to be the total taxable value of land and additions on the property. | Land | Improvement |
|---|---|---|---|---|
| 2026 | $7,974 | $1,006,500 | $687,000 | $319,500 |
| 2025 | $7,420 | $887,100 | $580,000 | $307,100 |
| 2024 | $7,420 | $825,400 | $529,000 | $296,400 |
| 2023 | $9,070 | $1,128,900 | $745,000 | $383,900 |
| 2022 | $7,946 | $785,800 | $460,000 | $325,800 |
| 2020 | $6,872 | $640,500 | $369,000 | $271,500 |
| 2019 | $6,196 | $583,900 | $315,000 | $268,900 |
| 2018 | $5,790 | $507,800 | $265,000 | $242,800 |
| 2017 | $4,943 | $440,600 | $215,000 | $225,600 |
| 2016 | $4,391 | $381,100 | $180,000 | $201,100 |
| 2015 | $4,596 | $379,600 | $170,000 | $209,600 |
| 2013 | $4,294 | $315,700 | $145,000 | $170,700 |
Source: Public Records
Map
Nearby Homes
- 18309 26th Dr SE
- 18501 28th Ave SE
- 2401 185th Place SE
- 18632 29th Ave SE
- 3028 183rd Place SE
- 18429 20th Dr SE
- 18223 31st Ave SE
- 3205 179th Place SE
- 18809 20th Dr SE
- 17529 Brook Blvd
- 18115 34th Dr SE
- 19102 20th Dr SE Unit B204
- 19102 20th Dr SE Unit B202
- 19102 20th Dr SE Unit B206
- 19218 26th Ave SE Unit 117
- 18725 35th Dr SE
- 3414 176th Place SE
- 3413 189th Place SE
- 3125 194th St SE
- 18910 Bothell Everett Hwy Unit H2
- 18220 26th Dr SE
- 2531 183rd St SE
- 2532 182nd St SE
- 18212 26th Dr SE
- 2606 183rd St SE
- 18304 26th Dr SE
- 2614 183rd St SE
- 2518 182nd St SE
- 2526 183rd St SE
- 18208 26th Dr SE
- 2607 182nd St SE
- 2516 183rd St SE
- 18227 26th Dr SE
- 18308 26th Dr SE
- 18228 25th Dr SE
- 18221 26th Dr SE
- 18220 25th Dr SE
- 18132 26th Dr SE
- 18303 26th Dr SE
Your Personal Tour Guide
Ask me questions while you tour the home.