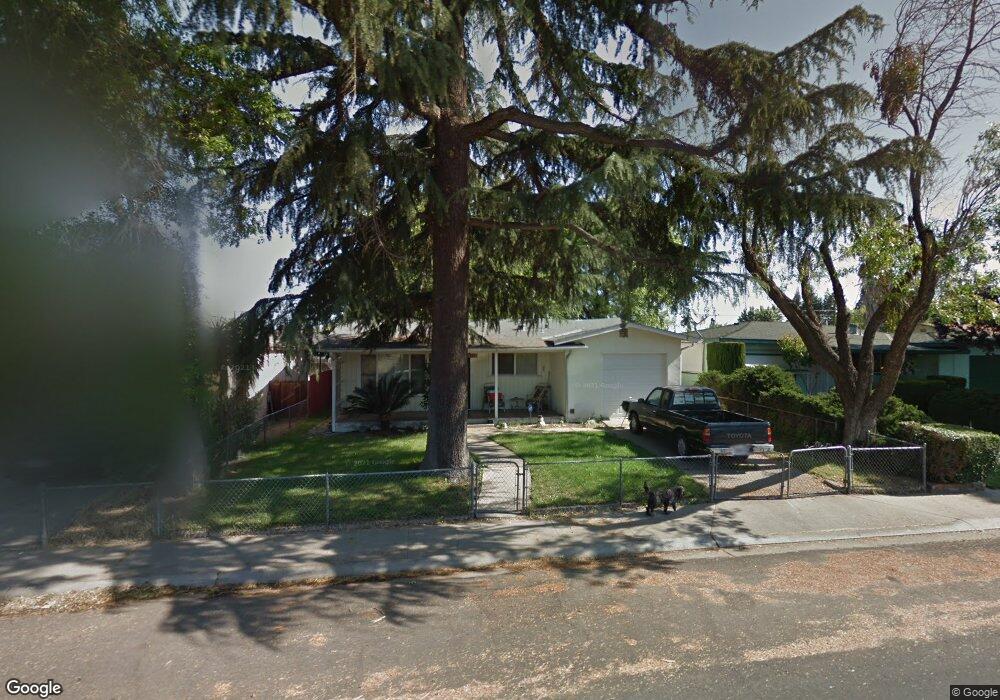
2609 Brenner Way Modesto, CA 95350
Estimated Value: $329,000 - $361,000
3
Beds
1
Bath
1,058
Sq Ft
$331/Sq Ft
Est. Value
About This Home
This home is located at 2609 Brenner Way, Modesto, CA 95350 and is currently estimated at $349,999, approximately $330 per square foot. 2609 Brenner Way is a home located in Stanislaus County with nearby schools including Josephine Chrysler Elementary School, Prescott Junior High School, and Grace M. Davis High School.
Ownership History
Date
Name
Owned For
Owner Type
Purchase Details
Closed on
Aug 4, 2009
Sold by
Schmidt Judith L and Mayland Delia
Bought by
Reyes Moses and Reyes Stephanie
Current Estimated Value
Home Financials for this Owner
Home Financials are based on the most recent Mortgage that was taken out on this home.
Original Mortgage
$81,000
Outstanding Balance
$52,488
Interest Rate
5.17%
Mortgage Type
FHA
Estimated Equity
$297,511
Purchase Details
Closed on
Dec 24, 2008
Sold by
Flores Tirado Benita
Bought by
Schmidt Judith L and Mayland Delia
Purchase Details
Closed on
Feb 8, 2008
Sold by
Flores Tirado Benita and The Manuel Tirado 1997 Living
Bought by
Flores Tirado Benita and Schmidt Judith L
Purchase Details
Closed on
Dec 18, 1997
Sold by
Tirado Manuel
Bought by
Tirado Manuel and Manuel Tirado 1997 Living Trus
Create a Home Valuation Report for This Property
The Home Valuation Report is an in-depth analysis detailing your home's value as well as a comparison with similar homes in the area
Purchase History
We collect this data history from publicly available records. To have your information removed, we recommend requesting removal directly through your county’s website.
| Date | Buyer | Sale Price | Title Company |
|---|---|---|---|
| Reyes Moses | $82,500 | Chicago Title Company | |
| Schmidt Judith L | -- | None Available | |
| Flores Tirado Benita | -- | None Available | |
| Tirado Manuel | -- | -- |
Source: Public Records
Mortgage History
We collect this data history from publicly available records. To have your information removed, we recommend requesting removal directly through your county’s website.
| Date | Status | Borrower | Loan Amount |
|---|---|---|---|
| Open | Reyes Moses | $81,000 |
Source: Public Records
Tax History
| Year | Tax Paid | Tax Assessment Tax Assessment Total Assessment is a certain percentage of the fair market value that is determined by local assessors to be the total taxable value of land and additions on the property. | Land | Improvement |
|---|---|---|---|---|
| 2025 | $1,147 | $106,475 | $32,263 | $74,212 |
| 2024 | $1,105 | $104,388 | $31,631 | $72,757 |
| 2023 | $1,083 | $102,342 | $31,011 | $71,331 |
| 2022 | $1,052 | $100,336 | $30,403 | $69,933 |
| 2021 | $993 | $98,369 | $29,807 | $68,562 |
| 2020 | $979 | $97,361 | $29,502 | $67,859 |
| 2019 | $966 | $95,453 | $28,924 | $66,529 |
| 2018 | $953 | $93,582 | $28,357 | $65,225 |
| 2017 | $929 | $91,748 | $27,801 | $63,947 |
| 2016 | $903 | $89,950 | $27,256 | $62,694 |
| 2015 | $894 | $88,600 | $26,847 | $61,753 |
| 2014 | $883 | $86,866 | $26,322 | $60,544 |
Source: Public Records
Map
Nearby Homes
- 2724 Sparks Way
- 2312 St James Place
- 2504 Bridle Path Ln
- 2329 Northridge Dr
- 2134 Whitcomb Way
- 2432 Eicher Ave
- 2112 Conant Ave
- 2621 Prescott Rd Unit 261
- 2621 Prescott Rd Unit 79
- 2621 Prescott Rd Unit 242
- 2621 Prescott Rd Unit 277
- 2621 Prescott Rd Unit 37
- 2621 Prescott Rd Unit 40
- 2621 Prescott Rd Unit 106
- 2621 Prescott Rd Unit 92
- 2621 Prescott Rd Unit 246
- 3305 Appaloosa Ct
- 2212 Palisade Ave
- 2137 Chrysler Dr
- 3037 Holiday Ln
- 2613 Brenner Way
- 2605 Brenner Way
- 2617 Brenner Way
- 2601 Brenner Way
- 2537 Brenner Way
- 2604 Brenner Way
- 2621 Brenner Way
- 2616 Brenner Way
- 2533 Brenner Way
- 2729 Garvey Ave
- 2728 Mcadoo Ave
- 2529 Brenner Way
- 2725 Garvey Ave
- 2724 Mcadoo Ave
- 2732 Garvey Ave
- 2701 Brenner Way
- 2525 Brenner Way
- 2721 Garvey Ave
- 2728 Garvey Ave
- 2720 Mcadoo Ave
Your Personal Tour Guide
Ask me questions while you tour the home.