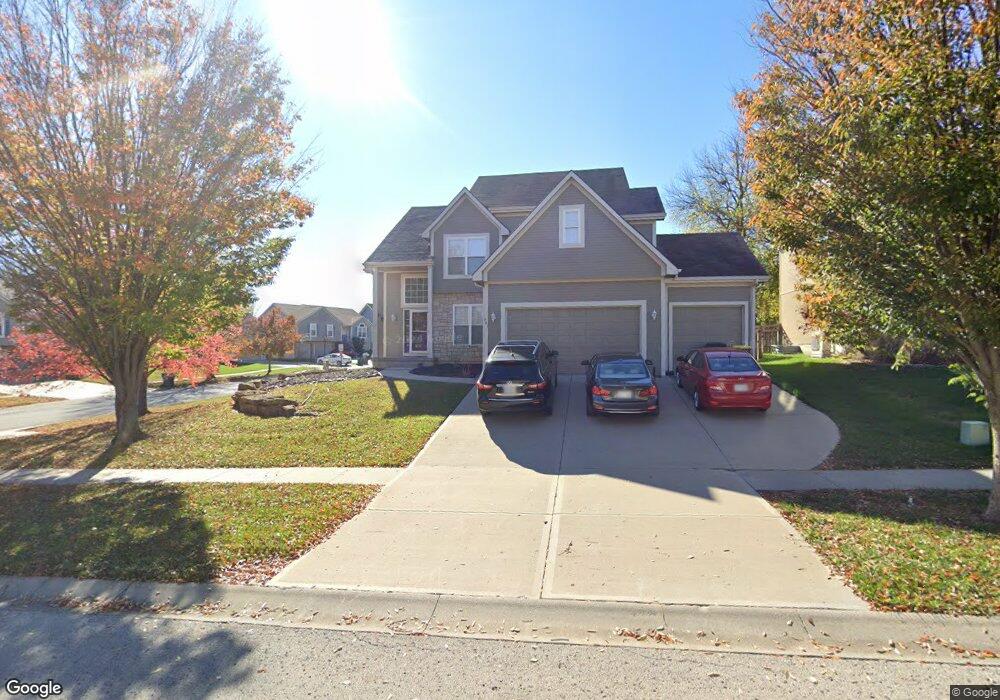
261 Ash Ln Lansing, KS 66043
Estimated Value: $380,000 - $391,000
4
Beds
3
Baths
2,361
Sq Ft
$163/Sq Ft
Est. Value
About This Home
This home is located at 261 Ash Ln, Lansing, KS 66043 and is currently estimated at $385,806, approximately $163 per square foot. 261 Ash Ln is a home located in Leavenworth County with nearby schools including Lansing Elementary School, Lansing Middle 6-8, and Lansing High 9-12.
Ownership History
Date
Name
Owned For
Owner Type
Purchase Details
Closed on
Feb 18, 2016
Sold by
Healy Brian D and Healy Debra A
Bought by
Jb Mc Kee Properties Llc
Current Estimated Value
Home Financials for this Owner
Home Financials are based on the most recent Mortgage that was taken out on this home.
Original Mortgage
$339,600
Outstanding Balance
$270,459
Interest Rate
3.92%
Mortgage Type
New Conventional
Estimated Equity
$115,347
Create a Home Valuation Report for This Property
The Home Valuation Report is an in-depth analysis detailing your home's value as well as a comparison with similar homes in the area
Home Values in the Area
Average Home Value in this Area
Purchase History
| Date | Buyer | Sale Price | Title Company |
|---|---|---|---|
| Jb Mc Kee Properties Llc | $424,500 | Kansas Secured Title |
Source: Public Records
Mortgage History
| Date | Status | Borrower | Loan Amount |
|---|---|---|---|
| Open | Jb Mc Kee Properties Llc | $339,600 |
Source: Public Records
Tax History Compared to Growth
Tax History
| Year | Tax Paid | Tax Assessment Tax Assessment Total Assessment is a certain percentage of the fair market value that is determined by local assessors to be the total taxable value of land and additions on the property. | Land | Improvement |
|---|---|---|---|---|
| 2025 | $5,446 | $41,883 | $5,574 | $36,309 |
| 2024 | $5,255 | $40,376 | $5,574 | $34,802 |
| 2023 | $5,255 | $40,376 | $5,574 | $34,802 |
| 2022 | $5,047 | $36,662 | $4,189 | $32,473 |
| 2021 | $4,583 | $31,809 | $4,189 | $27,620 |
| 2020 | $4,303 | $29,405 | $4,189 | $25,216 |
| 2019 | $4,106 | $28,037 | $4,189 | $23,848 |
| 2018 | $3,815 | $26,085 | $4,189 | $21,896 |
| 2017 | $3,614 | $24,667 | $4,189 | $20,478 |
| 2016 | $3,946 | $26,896 | $4,189 | $22,707 |
| 2015 | $3,935 | $26,896 | $4,189 | $22,707 |
| 2014 | $3,767 | $26,299 | $4,189 | $22,110 |
Source: Public Records
Map
Nearby Homes
- 922 Southfork St
- 722 Bittersweet Rd
- 624 S Bittersweet Ln
- 901 S Main St
- 115 W Gilman Rd
- 527 S Valley Dr
- 811 4-H Rd
- 104 Olive St
- 506 1st Terrace
- 131 Rock Creek Loop
- 000 4-H Rd
- 875 Clearview Dr
- 202 S Main St
- 124 S Main St
- 705 Rock Creek Dr
- 1221 S Desoto Rd
- 102 S 3rd Ct
- 833 Rock Creek Dr
- 218 E Kay St
- 209 E Kay St