261 Cedar St Jackson, TN 38301
Downtown Jackson NeighborhoodEstimated Value: $235,000 - $277,000
3
Beds
3
Baths
1,552
Sq Ft
$163/Sq Ft
Est. Value
About This Home
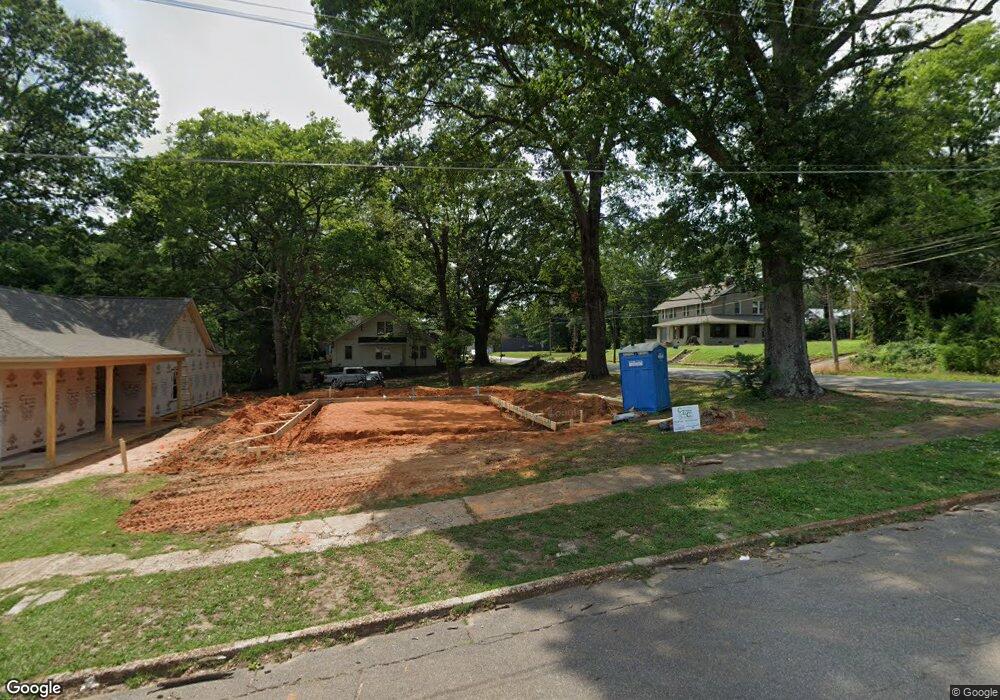
This home is located at 261 Cedar St, Jackson, TN 38301 and is currently estimated at $253,046, approximately $163 per square foot. 261 Cedar St is a home located in Madison County with nearby schools including Alexander Elementary School, North Parkway Middle School, and South Side High School.
Ownership History
Date
Name
Owned For
Owner Type
Purchase Details
Closed on
Aug 22, 2023
Sold by
Tab Properties Inc
Bought by
Shaub Properties Llc
Current Estimated Value
Purchase Details
Closed on
Aug 15, 2022
Sold by
Madison County
Bought by
Tab Properties Llc
Purchase Details
Closed on
Jan 20, 2022
Sold by
Clerk And Master Of The Chancery Court F
Bought by
City Of Jackson and Madison County
Purchase Details
Closed on
Feb 20, 2007
Sold by
Day Paige Freida
Bought by
Reid Khari B
Purchase Details
Closed on
Sep 28, 2001
Sold by
Abney T Robert Sub Tr
Bought by
Household Mortgage Service
Purchase Details
Closed on
Jul 20, 2001
Sold by
Abney T Robert Sub Tr
Bought by
Household Mortgage Service
Purchase Details
Closed on
Mar 7, 1998
Sold by
Charlotte Bush
Bought by
Dawson Robert L
Purchase Details
Closed on
Apr 8, 1980
Bought by
Bush Charlotte
Purchase Details
Closed on
Jan 1, 1977
Purchase Details
Closed on
Mar 10, 1960
Create a Home Valuation Report for This Property
The Home Valuation Report is an in-depth analysis detailing your home's value as well as a comparison with similar homes in the area
Home Values in the Area
Average Home Value in this Area
Purchase History
| Date | Buyer | Sale Price | Title Company |
|---|---|---|---|
| Shaub Properties Llc | -- | None Listed On Document | |
| Tab Properties Llc | $15,125 | -- | |
| City Of Jackson | -- | Spragins Barnett & Cobb Plc | |
| Reid Khari B | -- | -- | |
| Household Mortgage Service | -- | -- | |
| Household Mortgage Service | $41,360 | -- | |
| Dawson Robert L | -- | -- | |
| Bush Charlotte | -- | -- | |
| -- | $3,200 | -- | |
| -- | -- | -- |
Source: Public Records
Tax History
| Year | Tax Paid | Tax Assessment Tax Assessment Total Assessment is a certain percentage of the fair market value that is determined by local assessors to be the total taxable value of land and additions on the property. | Land | Improvement |
|---|---|---|---|---|
| 2025 | $781 | $41,675 | $1,725 | $39,950 |
| 2024 | $781 | $41,675 | $1,725 | $39,950 |
| 2022 | $2 | $75 | $75 | $0 |
| 2021 | $46 | $1,050 | $1,050 | $0 |
| 2020 | $46 | $1,050 | $1,050 | $0 |
| 2019 | $46 | $1,050 | $1,050 | $0 |
| 2018 | $46 | $1,050 | $1,050 | $0 |
| 2017 | $47 | $1,050 | $1,050 | $0 |
| 2016 | $44 | $1,050 | $1,050 | $0 |
| 2015 | $43 | $1,050 | $1,050 | $0 |
| 2014 | $43 | $1,050 | $1,050 | $0 |
Source: Public Records
Map
Nearby Homes
- 218 W King St
- 225 Linden St
- 205 McCowat St
- 219 Clay St
- 161 W Grand St
- 214 McCowat St
- 222 Elm St
- 119 Otis St
- 234 McCowat St
- 426 W King St
- 337 Linden St
- 221 W Deaderick St
- 122 Campbell St
- 425 Arlington Ave
- 559 N Cumberland St
- 431 Arlington Ave
- 915 N Highland Ave
- 275 W Deaderick St
- 520 Lambuth Blvd
- 223 Morgan St
Your Personal Tour Guide
Ask me questions while you tour the home.