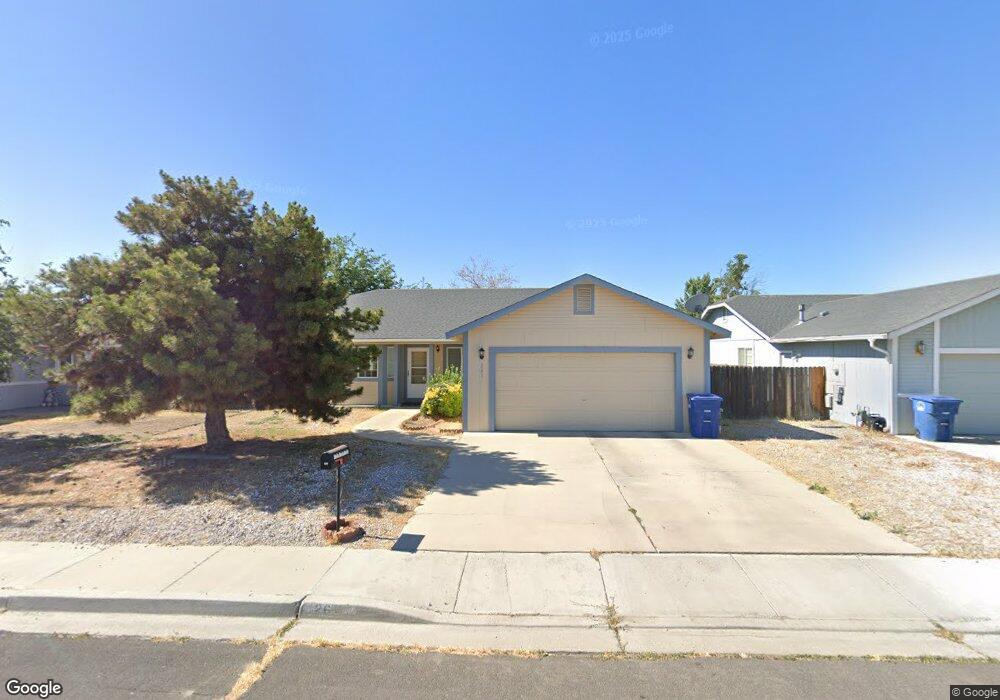
261 Dianna Way Fallon, NV 89406
Estimated Value: $350,012 - $373,000
3
Beds
2
Baths
1,522
Sq Ft
$237/Sq Ft
Est. Value
About This Home
This home is located at 261 Dianna Way, Fallon, NV 89406 and is currently estimated at $360,503, approximately $236 per square foot. 261 Dianna Way is a home located in Churchill County with nearby schools including E.C. Best Elementary School, Numa Elementary School, and Lahontan Elementary School.
Ownership History
Date
Name
Owned For
Owner Type
Purchase Details
Closed on
Apr 10, 2017
Sold by
Poi Dog Properties Llc
Bought by
Rasmussen Joel L
Current Estimated Value
Home Financials for this Owner
Home Financials are based on the most recent Mortgage that was taken out on this home.
Original Mortgage
$184,907
Interest Rate
3.97%
Mortgage Type
VA
Purchase Details
Closed on
Jun 15, 2010
Sold by
Thunder Kenneth T and Soong Tamara J
Bought by
Poi Dog Properties Llc
Create a Home Valuation Report for This Property
The Home Valuation Report is an in-depth analysis detailing your home's value as well as a comparison with similar homes in the area
Home Values in the Area
Average Home Value in this Area
Purchase History
| Date | Buyer | Sale Price | Title Company |
|---|---|---|---|
| Rasmussen Joel L | $179,000 | Western Nevada Title Company | |
| Poi Dog Properties Llc | -- | None Available |
Source: Public Records
Mortgage History
| Date | Status | Borrower | Loan Amount |
|---|---|---|---|
| Previous Owner | Rasmussen Joel L | $184,907 |
Source: Public Records
Tax History Compared to Growth
Tax History
| Year | Tax Paid | Tax Assessment Tax Assessment Total Assessment is a certain percentage of the fair market value that is determined by local assessors to be the total taxable value of land and additions on the property. | Land | Improvement |
|---|---|---|---|---|
| 2025 | $2,195 | $74,171 | $21,700 | $52,471 |
| 2024 | $2,195 | $72,903 | $19,950 | $52,953 |
| 2023 | $2,195 | $69,873 | $19,950 | $49,923 |
| 2022 | $1,881 | $55,260 | $11,900 | $43,360 |
| 2021 | $1,741 | $54,005 | $11,900 | $42,105 |
| 2020 | $1,677 | $50,794 | $11,900 | $38,894 |
| 2019 | $1,619 | $49,870 | $11,900 | $37,970 |
| 2018 | $1,545 | $49,100 | $11,900 | $37,200 |
| 2017 | $1,483 | $47,804 | $10,500 | $37,304 |
| 2016 | $1,445 | $42,389 | $7,875 | $34,514 |
| 2015 | $1,417 | $38,549 | $7,875 | $30,674 |
| 2014 | $1,378 | $35,881 | $7,875 | $28,006 |
Source: Public Records
Map
Nearby Homes
- 365 Kathy St Unit 3
- 738 Noel Ln
- 714 Noel Ln
- 815 Great Basin Ln
- 775 Karry Way
- 505 Hunter Park Way
- 641 Megan Way
- 882 Great Basin Ln
- 215 Hunter Park Way
- 410 Heron Ln
- 411 Heron Ln
- 696 Sunrise Terrace
- 1004 Conifer Dr
- 1415 Golden Park Way
- 231 N Ada St
- 604 Serpa Place
- 00 Serpa Place
- 1125 Alder Dr
- 1430 Golden Park Way
- 654 Sycamore Dr