261 Elm St Concord, NH 03303
West Concord NeighborhoodEstimated Value: $589,000 - $669,000
4
Beds
4
Baths
2,298
Sq Ft
$270/Sq Ft
Est. Value
About This Home
This home is located at 261 Elm St, Concord, NH 03303 and is currently estimated at $619,696, approximately $269 per square foot. 261 Elm St is a home located in Merrimack County with nearby schools including Beaver Meadow School, Rundlett Middle School, and Concord High School.
Ownership History
Date
Name
Owned For
Owner Type
Purchase Details
Closed on
Aug 16, 2017
Sold by
Starkweather Don C and Starkweather Veronica
Bought by
Starkweather Ft
Current Estimated Value
Purchase Details
Closed on
Oct 10, 2002
Sold by
Newell & Crathern Llc
Bought by
Starkweather Don C and Starkweather Veronica
Home Financials for this Owner
Home Financials are based on the most recent Mortgage that was taken out on this home.
Original Mortgage
$224,000
Interest Rate
6.24%
Mortgage Type
Purchase Money Mortgage
Create a Home Valuation Report for This Property
The Home Valuation Report is an in-depth analysis detailing your home's value as well as a comparison with similar homes in the area
Home Values in the Area
Average Home Value in this Area
Purchase History
| Date | Buyer | Sale Price | Title Company |
|---|---|---|---|
| Starkweather Ft | -- | -- | |
| Starkweather Don C | $280,300 | -- |
Source: Public Records
Mortgage History
| Date | Status | Borrower | Loan Amount |
|---|---|---|---|
| Previous Owner | Starkweather Don C | $287,162 | |
| Previous Owner | Starkweather Don C | $224,000 |
Source: Public Records
Tax History Compared to Growth
Tax History
| Year | Tax Paid | Tax Assessment Tax Assessment Total Assessment is a certain percentage of the fair market value that is determined by local assessors to be the total taxable value of land and additions on the property. | Land | Improvement |
|---|---|---|---|---|
| 2024 | $10,998 | $397,200 | $125,700 | $271,500 |
| 2023 | $10,669 | $397,200 | $125,700 | $271,500 |
| 2022 | $10,284 | $397,200 | $125,700 | $271,500 |
| 2021 | $9,965 | $396,700 | $125,700 | $271,000 |
| 2020 | $9,543 | $356,600 | $93,900 | $262,700 |
| 2019 | $9,370 | $337,300 | $85,900 | $251,400 |
| 2018 | $9,021 | $320,000 | $77,100 | $242,900 |
| 2017 | $8,915 | $315,700 | $78,100 | $237,600 |
| 2016 | $8,395 | $303,400 | $78,100 | $225,300 |
| 2015 | $7,672 | $284,400 | $78,100 | $206,300 |
| 2014 | $7,625 | $284,400 | $78,100 | $206,300 |
| 2013 | -- | $284,400 | $78,100 | $206,300 |
| 2012 | -- | $306,300 | $78,100 | $228,200 |
Source: Public Records
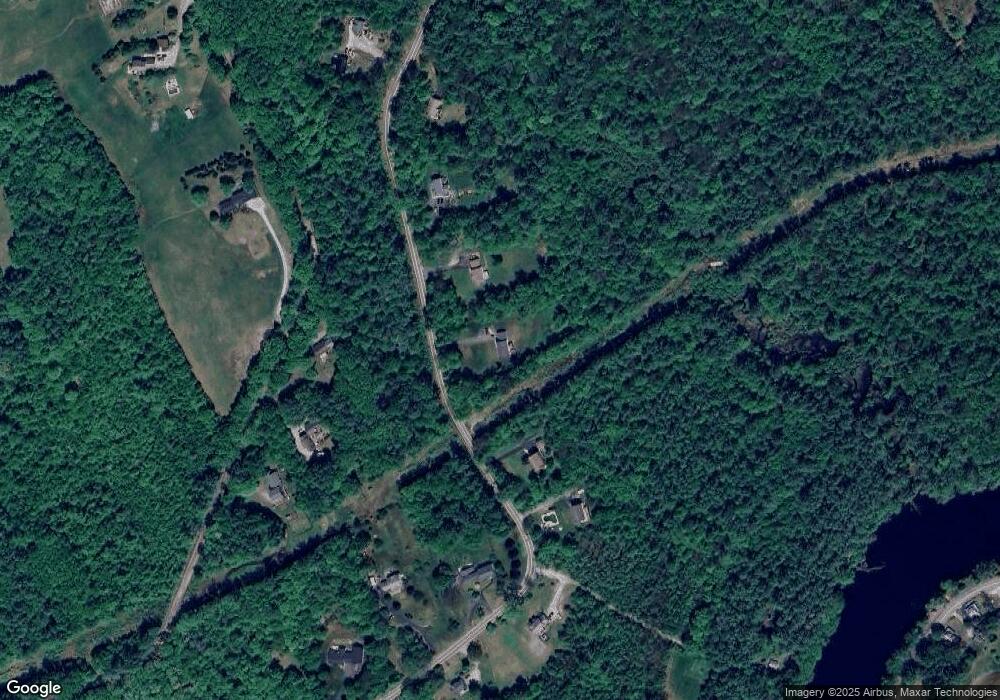
Map
Nearby Homes
- 50 Weir Rd
- 13 Whitewater Dr
- 26 Whitewater Dr
- 20 Millstream Ln
- 105 Lilac St
- 271 Village St Unit 273
- 291 Village St Unit 297
- 5 Bonney St
- 3 Merlot Ct Unit 4
- 26 Crescent St
- 3 Cabernet Dr Unit 3
- 12 Cross St Unit 201
- 13 Cheryl Dr
- 18 Dawn Dr
- 148 Broad Cove Dr
- 13 Suffolk Rd Unit 5
- 13 Suffolk Rd Unit 4
- 13 Suffolk Rd Unit 8
- 10 Jackson St
- 4A Villa Brasi Ln