261 Sunderland Way Unit 80 Stockbridge, GA 30281
Estimated Value: $339,672 - $351,000
4
Beds
3
Baths
2,332
Sq Ft
$148/Sq Ft
Est. Value
About This Home
This home is located at 261 Sunderland Way Unit 80, Stockbridge, GA 30281 and is currently estimated at $344,418, approximately $147 per square foot. 261 Sunderland Way Unit 80 is a home located in Henry County with nearby schools including Red Oak Elementary School, Dutchtown Middle School, and Dutchtown High School.
Ownership History
Date
Name
Owned For
Owner Type
Purchase Details
Closed on
Dec 1, 2021
Sold by
Ransom Cicelie
Bought by
Sfr Acquisitions 1 Llc
Current Estimated Value
Purchase Details
Closed on
Oct 30, 2019
Sold by
Opendoor Property D Llc
Bought by
Ransom Cicelie
Home Financials for this Owner
Home Financials are based on the most recent Mortgage that was taken out on this home.
Original Mortgage
$199,500
Interest Rate
3.65%
Mortgage Type
New Conventional
Purchase Details
Closed on
Jun 18, 2019
Sold by
Carlyle Cynthia B
Bought by
Opendoor Property D Llc
Home Financials for this Owner
Home Financials are based on the most recent Mortgage that was taken out on this home.
Original Mortgage
$400,000,000
Interest Rate
4%
Mortgage Type
Commercial
Purchase Details
Closed on
Aug 30, 2002
Sold by
Tim Jones Cmntys Inc
Bought by
Carlyle Cynthia B
Home Financials for this Owner
Home Financials are based on the most recent Mortgage that was taken out on this home.
Original Mortgage
$173,717
Interest Rate
6.31%
Mortgage Type
FHA
Create a Home Valuation Report for This Property
The Home Valuation Report is an in-depth analysis detailing your home's value as well as a comparison with similar homes in the area
Home Values in the Area
Average Home Value in this Area
Purchase History
| Date | Buyer | Sale Price | Title Company |
|---|---|---|---|
| Sfr Acquisitions 1 Llc | $320,000 | -- | |
| Ransom Cicelie | $210,000 | -- | |
| Opendoor Property D Llc | $202,700 | -- | |
| Carlyle Cynthia B | $176,500 | -- | |
| Tim Jones Cmntys Inc | $27,000 | -- |
Source: Public Records
Mortgage History
| Date | Status | Borrower | Loan Amount |
|---|---|---|---|
| Previous Owner | Ransom Cicelie | $199,500 | |
| Previous Owner | Opendoor Property D Llc | $400,000,000 | |
| Previous Owner | Tim Jones Cmntys Inc | $173,717 |
Source: Public Records
Tax History Compared to Growth
Tax History
| Year | Tax Paid | Tax Assessment Tax Assessment Total Assessment is a certain percentage of the fair market value that is determined by local assessors to be the total taxable value of land and additions on the property. | Land | Improvement |
|---|---|---|---|---|
| 2025 | $5,434 | $131,680 | $20,062 | $111,618 |
| 2024 | $5,434 | $131,680 | $20,720 | $110,960 |
| 2023 | $6,100 | $145,320 | $16,120 | $129,200 |
| 2022 | $4,681 | $115,800 | $16,120 | $99,680 |
| 2021 | $3,224 | $86,040 | $13,800 | $72,240 |
| 2020 | $3,138 | $82,440 | $11,520 | $70,920 |
| 2019 | $3,324 | $82,000 | $11,520 | $70,480 |
| 2018 | $3,179 | $78,200 | $11,520 | $66,680 |
| 2016 | $2,781 | $67,840 | $15,000 | $52,840 |
| 2015 | $2,592 | $61,000 | $10,000 | $51,000 |
| 2014 | $2,188 | $50,200 | $8,000 | $42,200 |
Source: Public Records
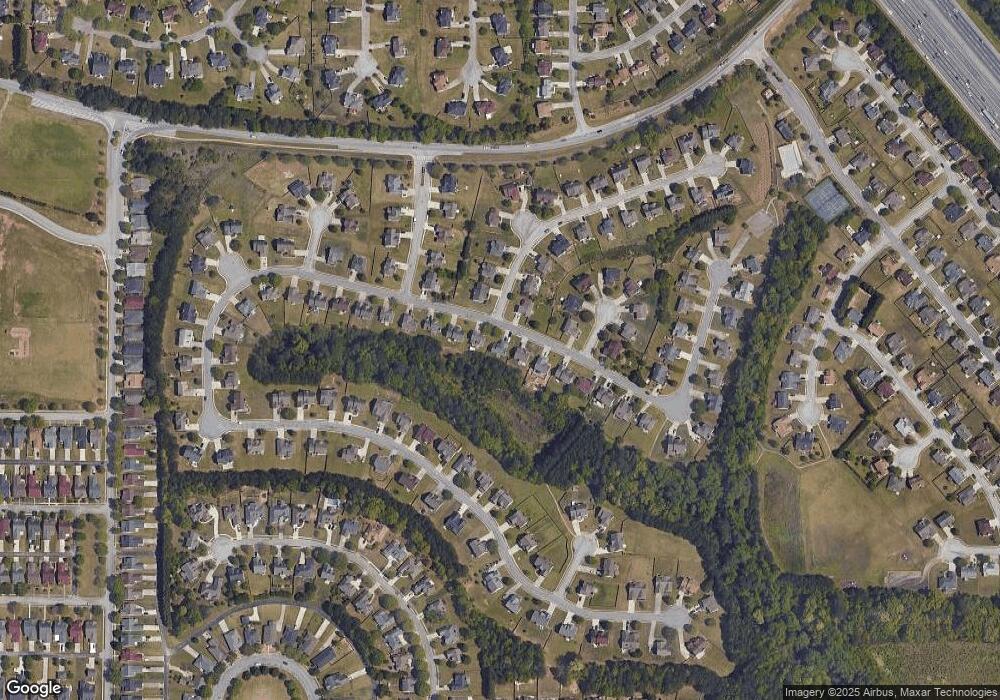
Map
Nearby Homes
- 512 Chaucer Way Unit 1
- 213 Sunderland Way Unit 1
- 300 Monarch Village Way
- 1341 Kent Manor Unit 3
- 719 Nightwind Way
- 266 Monarch Village Way
- 1653 Jersey Dr
- 602 Brookwater Dr
- 263 Northwind Dr
- 687 Pathwood Ln
- 1545 Brangus Dr
- 591 Creek Valley Ct
- 404 Northwind Place
- 469 Village Cir
- 623 Brookwater Dr
- 486 Village Cir
- 117 Titan Rd
- 198 Broder Farms Dr
- 261 Sunderland Way
- 265 Sunderland Way
- 257 Sunderland Way
- 269 Sunderland Way Unit 1
- 253 Sunderland Way
- 253 Sunderland Way Unit 1
- 236 Sunderland Way Unit I
- 249 Sunderland Way
- 249 Sunderland Way
- 249 Sunderland Way Unit 83
- 273 Sunderland Way
- 273 Sunderland Way Unit 1
- 353 Sunderland Way Unit 2
- 349 Sunderland Way Unit 2
- 501 Chaucer Way
- 601 Lockwood Ct
- 601 Lockwood Ct Unit 1
- 345 Sunderland Way
- 345 Sunderland Way Unit 2
- 504 Chaucer Way Unit 1