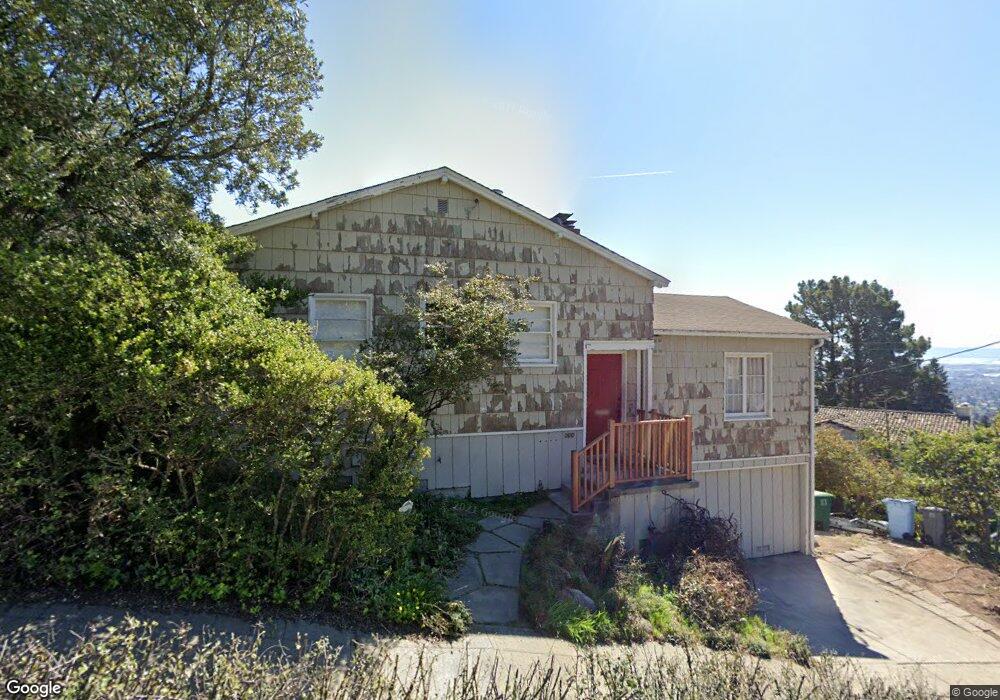
2610 Marin Ave Berkeley, CA 94708
Berkeley Hills NeighborhoodEstimated Value: $1,183,717 - $1,370,000
2
Beds
1
Bath
1,178
Sq Ft
$1,071/Sq Ft
Est. Value
About This Home
This home is located at 2610 Marin Ave, Berkeley, CA 94708 and is currently estimated at $1,261,679, approximately $1,071 per square foot. 2610 Marin Ave is a home located in Alameda County with nearby schools including Cragmont Elementary School, Berkeley Arts Magnet at Whittier School, and Washington Elementary School.
Ownership History
Date
Name
Owned For
Owner Type
Purchase Details
Closed on
Jul 26, 2012
Sold by
Sharnoff Stephen M M and Sharnoff Stephen M
Bought by
Sharnoff Meera
Current Estimated Value
Home Financials for this Owner
Home Financials are based on the most recent Mortgage that was taken out on this home.
Original Mortgage
$506,200
Outstanding Balance
$348,853
Interest Rate
3.56%
Mortgage Type
New Conventional
Estimated Equity
$912,826
Purchase Details
Closed on
Jul 12, 2012
Sold by
Feinstein Jonathan
Bought by
Sharnoff Meera
Home Financials for this Owner
Home Financials are based on the most recent Mortgage that was taken out on this home.
Original Mortgage
$506,200
Outstanding Balance
$348,853
Interest Rate
3.56%
Mortgage Type
New Conventional
Estimated Equity
$912,826
Purchase Details
Closed on
Mar 1, 1999
Sold by
Sharnoff Stephen M & Sylvia D Living Tr and Stephen M
Bought by
Sharnoff Stephen M M and Sharnoff Stephen M
Create a Home Valuation Report for This Property
The Home Valuation Report is an in-depth analysis detailing your home's value as well as a comparison with similar homes in the area
Home Values in the Area
Average Home Value in this Area
Purchase History
| Date | Buyer | Sale Price | Title Company |
|---|---|---|---|
| Sharnoff Meera | $562,500 | Old Republic Title Company | |
| Sharnoff Meera | -- | Old Republic Title Company | |
| Sharnoff Stephen M M | -- | -- |
Source: Public Records
Mortgage History
| Date | Status | Borrower | Loan Amount |
|---|---|---|---|
| Open | Sharnoff Meera | $506,200 |
Source: Public Records
Tax History
| Year | Tax Paid | Tax Assessment Tax Assessment Total Assessment is a certain percentage of the fair market value that is determined by local assessors to be the total taxable value of land and additions on the property. | Land | Improvement |
|---|---|---|---|---|
| 2025 | $4,301 | $110,463 | $59,578 | $50,885 |
| 2024 | $4,301 | $108,297 | $58,410 | $49,887 |
| 2023 | $4,181 | $106,174 | $57,265 | $48,909 |
| 2022 | $4,238 | $104,092 | $56,142 | $47,950 |
| 2021 | $4,009 | $102,051 | $55,041 | $47,010 |
| 2020 | $3,656 | $101,005 | $54,477 | $46,528 |
| 2019 | $3,359 | $99,025 | $53,409 | $45,616 |
| 2018 | $3,264 | $97,084 | $52,362 | $44,722 |
| 2017 | $3,117 | $95,180 | $51,335 | $43,845 |
| 2016 | $2,909 | $93,314 | $50,329 | $42,985 |
| 2015 | $2,697 | $91,913 | $49,573 | $42,340 |
| 2014 | $2,595 | $90,112 | $48,602 | $41,510 |
Source: Public Records
Map
Nearby Homes
- 935 Grizzly Peak Blvd
- 1024 Grizzly Peak Blvd
- 962 Regal Rd
- 730 Wildcat Canyon Rd
- 1085 Creston Rd
- 777 Cragmont Ave
- 1040 Park Hills Rd
- 1106 Cragmont Ave
- 1004 Cragmont Ave
- 758 Spruce St
- 938 San Benito Rd
- 606 Grizzly Peak Blvd
- 1110 Sterling Ave
- 1155 Keeler Ave
- 1165 Cragmont Ave
- 1160 Miller Ave
- 614 Cragmont Ave
- 813 San Diego Rd
- 543 Grizzly Peak Blvd
- 765 San Diego Rd
- 907 Keeler Ave
- 2620 Marin Ave
- 911 Keeler Ave
- 893 Keeler Ave
- 2615 Marin Ave
- 2633 Marin Ave
- 915 Keeler Ave
- 2635 Marin Ave
- 900 Grizzly Peak Blvd
- 900 Keeler Ave
- 875 Keeler Ave
- 906 Grizzly Peak Blvd
- 920 Keeler Ave
- 2637 Marin Ave
- 912 Grizzly Peak Blvd
- 871 Keeler Ave
- 922 Keeler Ave
- 925 Keeler Ave
- 890 Grizzly Peak Blvd
- 861 Keeler Ave
Your Personal Tour Guide
Ask me questions while you tour the home.