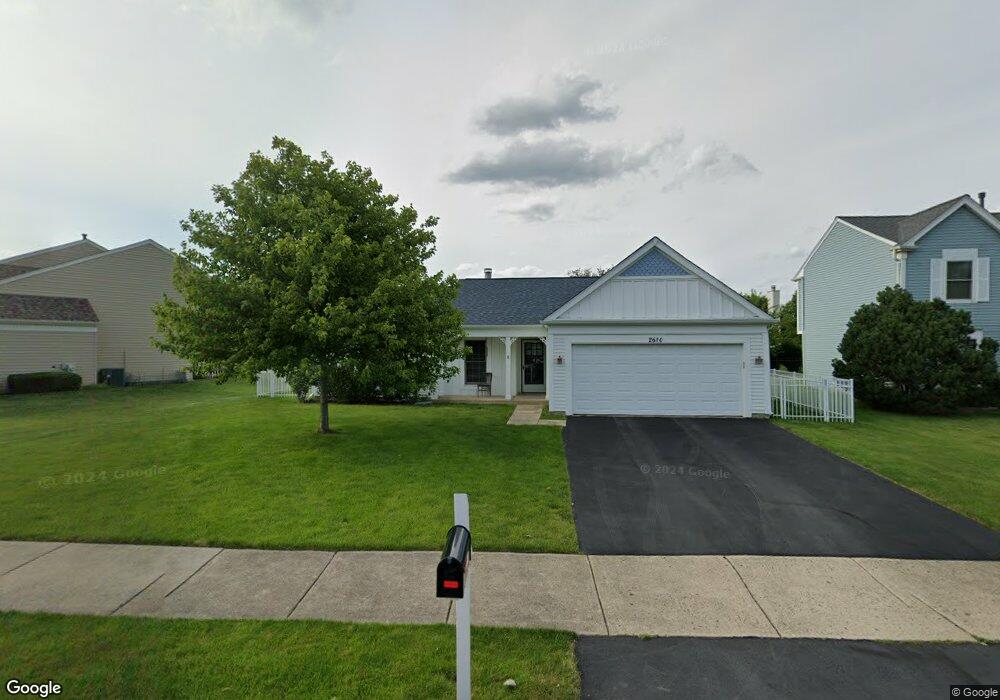
2610 Moss Ln Unit 6 Aurora, IL 60504
South East Village NeighborhoodEstimated Value: $333,000 - $373,000
3
Beds
2
Baths
1,248
Sq Ft
$277/Sq Ft
Est. Value
About This Home
This home is located at 2610 Moss Ln Unit 6, Aurora, IL 60504 and is currently estimated at $345,623, approximately $276 per square foot. 2610 Moss Ln Unit 6 is a home located in DuPage County with nearby schools including Gombert Elementary School, Fischer Middle School, and Waubonsie Valley High School.
Ownership History
Date
Name
Owned For
Owner Type
Purchase Details
Closed on
Jun 24, 2015
Sold by
Wray John R
Bought by
Wray John R and John R Wray Revocable Living T
Current Estimated Value
Purchase Details
Closed on
Jan 28, 2000
Sold by
Stewart Susan Stachelski and Macdonald George V
Bought by
Wray John R
Home Financials for this Owner
Home Financials are based on the most recent Mortgage that was taken out on this home.
Original Mortgage
$133,500
Outstanding Balance
$43,874
Interest Rate
8.08%
Mortgage Type
VA
Estimated Equity
$301,749
Purchase Details
Closed on
Jun 28, 1994
Sold by
Sundby Brian J
Bought by
Stachelski Susan R and Macdonald George V
Home Financials for this Owner
Home Financials are based on the most recent Mortgage that was taken out on this home.
Original Mortgage
$123,671
Interest Rate
8.66%
Mortgage Type
FHA
Create a Home Valuation Report for This Property
The Home Valuation Report is an in-depth analysis detailing your home's value as well as a comparison with similar homes in the area
Home Values in the Area
Average Home Value in this Area
Purchase History
| Date | Buyer | Sale Price | Title Company |
|---|---|---|---|
| Wray John R | -- | None Available | |
| Wray John R | $133,500 | First American Title Ins | |
| Stachelski Susan R | $126,000 | -- |
Source: Public Records
Mortgage History
| Date | Status | Borrower | Loan Amount |
|---|---|---|---|
| Open | Wray John R | $133,500 | |
| Previous Owner | Stachelski Susan R | $123,671 |
Source: Public Records
Tax History Compared to Growth
Tax History
| Year | Tax Paid | Tax Assessment Tax Assessment Total Assessment is a certain percentage of the fair market value that is determined by local assessors to be the total taxable value of land and additions on the property. | Land | Improvement |
|---|---|---|---|---|
| 2024 | $3,012 | $91,725 | $26,220 | $65,505 |
| 2023 | $4,992 | $82,420 | $23,560 | $58,860 |
| 2022 | $3,741 | $75,380 | $21,370 | $54,010 |
| 2021 | $3,784 | $72,690 | $20,610 | $52,080 |
| 2020 | $3,831 | $72,690 | $20,610 | $52,080 |
| 2019 | $4,641 | $69,130 | $19,600 | $49,530 |
| 2018 | $3,940 | $60,610 | $16,730 | $43,880 |
| 2017 | $3,834 | $58,550 | $16,160 | $42,390 |
| 2016 | $3,716 | $56,190 | $15,510 | $40,680 |
| 2015 | $3,613 | $53,350 | $14,730 | $38,620 |
| 2014 | $3,799 | $51,630 | $14,140 | $37,490 |
| 2013 | $4,257 | $51,990 | $14,240 | $37,750 |
Source: Public Records
Map
Nearby Homes
- 2632 Emma Cir
- 2730 Dorothy Dr Unit 1
- 2509 Rosehall Ln
- 2489 Rosehall Ln
- 1335 Lawrence Ct
- 1465 Bridgeport Ln Unit 19D
- 2723 Rosehall Ln
- 2860 Bridgeport Ln Unit 19D
- 2476 Village Ct Unit 2
- 2297 Lakeside Dr Unit 10
- 2484 Warwick Ct
- 1629 Silver Springs Ct
- 2538 Needham Ct
- 3144 Johnsbury Ln
- 3290 Johnsbury Ct
- 1722 Baler Ave
- 1728 Baler Ave
- 1716 Baler Ave
- 1734 Baler Ave
- 1966 Congrove Dr
- 2620 Moss Ln Unit 6
- 2600 Moss Ln
- 2585 Ridge Rd Unit 6
- 2595 Ridge Rd
- 2630 Moss Ln
- 2580 Moss Ln
- 2615 Moss Ln
- 2609 Moss Ln Unit 6
- 2605 Ridge Rd
- 2625 Moss Ln
- 2605 Moss Ln Unit 6
- 2595 Moss Ln Unit 6
- 2615 Ridge Rd
- 2629 Moss Ln Unit 6
- 2585 Moss Ln Unit 6
- 2575 Moss Ln
- 2650 Moss Ln
- 2560 Ridge Rd Unit 6
- 1404 Farrington Ln
- 2635 Moss Ln