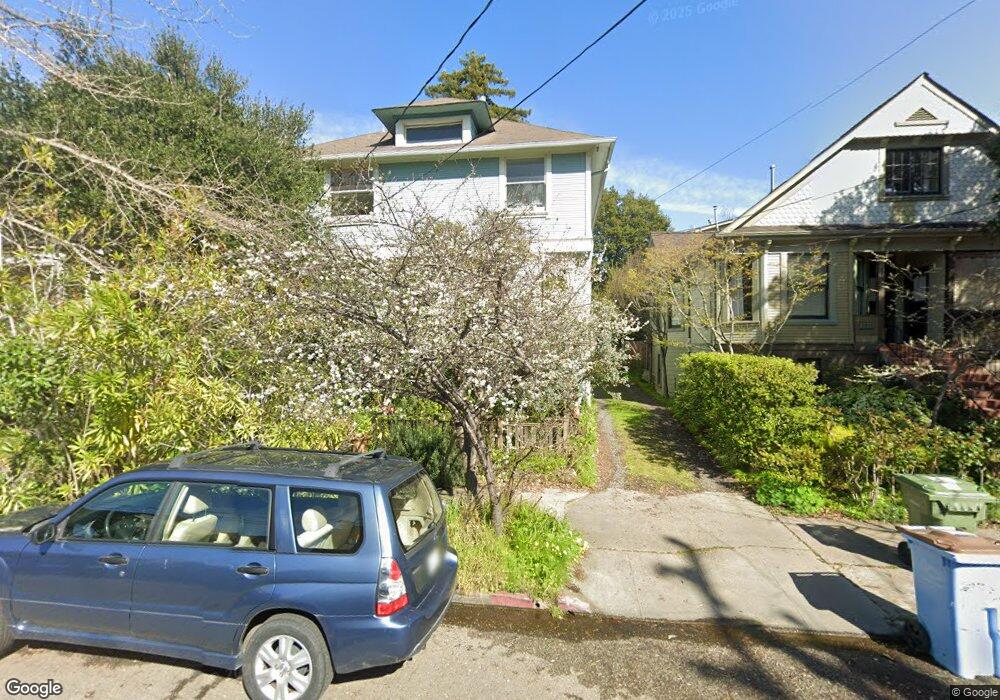
2611 Benvenue Ave Unit 1 Berkeley, CA 94704
Elmwood NeighborhoodEstimated Value: $501,681 - $624,000
1
Bed
1
Bath
570
Sq Ft
$989/Sq Ft
Est. Value
About This Home
This home is located at 2611 Benvenue Ave Unit 1, Berkeley, CA 94704 and is currently estimated at $563,920, approximately $989 per square foot. 2611 Benvenue Ave Unit 1 is a home located in Alameda County with nearby schools including Emerson Elementary School, John Muir Elementary School, and Malcolm X Elementary School.
Ownership History
Date
Name
Owned For
Owner Type
Purchase Details
Closed on
Dec 19, 2018
Sold by
Xu Feng and Shi Jianbo
Bought by
Xu Feng and Shi Jianbo
Current Estimated Value
Purchase Details
Closed on
Aug 6, 2015
Sold by
Waterfield Gina M and Elsen Paul R
Bought by
Xu Feng and Shi Jianbo
Purchase Details
Closed on
Jul 5, 2011
Sold by
Kam Petrice P
Bought by
Waterfield Gina M and Elsen Paul R
Home Financials for this Owner
Home Financials are based on the most recent Mortgage that was taken out on this home.
Original Mortgage
$165,000
Interest Rate
3.37%
Mortgage Type
New Conventional
Purchase Details
Closed on
Jan 11, 2011
Sold by
Kam Petrice P and Kam Charles K
Bought by
Kam Petrice P
Purchase Details
Closed on
Sep 7, 2006
Sold by
Oxenberg Krishna Luna and Mccluskey Maureen
Bought by
Kam Petrice P and Kam Charles K
Create a Home Valuation Report for This Property
The Home Valuation Report is an in-depth analysis detailing your home's value as well as a comparison with similar homes in the area
Home Values in the Area
Average Home Value in this Area
Purchase History
| Date | Buyer | Sale Price | Title Company |
|---|---|---|---|
| Xu Feng | -- | None Available | |
| Xu Feng | $383,500 | Fidelity National Title Co | |
| Waterfield Gina M | $250,000 | Fidelity National Title Co | |
| Kam Petrice P | -- | None Available | |
| Kam Petrice P | -- | Placer Title Company |
Source: Public Records
Mortgage History
| Date | Status | Borrower | Loan Amount |
|---|---|---|---|
| Previous Owner | Waterfield Gina M | $165,000 |
Source: Public Records
Tax History Compared to Growth
Tax History
| Year | Tax Paid | Tax Assessment Tax Assessment Total Assessment is a certain percentage of the fair market value that is determined by local assessors to be the total taxable value of land and additions on the property. | Land | Improvement |
|---|---|---|---|---|
| 2025 | $6,635 | $453,975 | $136,192 | $317,783 |
| 2024 | $6,635 | $445,074 | $133,522 | $311,552 |
| 2023 | $6,500 | $436,350 | $130,905 | $305,445 |
| 2022 | $6,394 | $427,793 | $128,338 | $299,455 |
| 2021 | $6,413 | $419,406 | $125,822 | $293,584 |
| 2020 | $6,114 | $415,107 | $124,532 | $290,575 |
| 2019 | $5,919 | $406,970 | $122,091 | $284,879 |
| 2018 | $5,827 | $398,993 | $119,698 | $279,295 |
| 2017 | $5,610 | $391,170 | $117,351 | $273,819 |
| 2016 | $5,454 | $383,500 | $115,050 | $268,450 |
| 2015 | $3,878 | $261,274 | $78,382 | $182,892 |
| 2014 | $3,852 | $256,157 | $76,847 | $179,310 |
Source: Public Records
Map
Nearby Homes
- 2644 Parker St
- 2670 Parker St
- 2601 College Ave Unit 203
- 2601 College Ave Unit 208
- 2732 Parker St
- 2610 Piedmont Ave
- 2519 Etna St Unit 1
- 2587 Piedmont Ave Unit 3
- 2741 Dwight Way
- 2509 Dwight Way
- 2543 Chilton Way
- 2409 College Ave
- 2550 Dana St Unit 5E
- 2915 Benvenue Ave Unit C
- 2910 Hillegass Ave Unit 2
- 2525 Durant Ave
- 2316 Blake St Unit D
- 2420 Hillside Ave
- 2308 Parker St
- 2907 Channing Way
- 2611 Benvenue Ave
- 2611 Benvenue Ave
- 2611 Benvenue Ave Unit 2
- 2607 Benvenue Ave
- 2615 Benvenue Ave
- 2615 Benvenue Ave Unit 2
- 2617 Benvenue Ave Unit 3
- 2619 Benvenue Ave
- 2603 Benvenue Ave Unit 4
- 2603 Benvenue Ave Unit 3
- 2603 Benvenue Ave Unit 2
- 2603 Benvenue Ave Unit 1
- 2640 Parker St
- 2621 Benvenue Ave Unit B
- 2621 Benvenue Ave Unit A
- 2623 Benvenue Ave Unit B
- 2623 Benvenue Ave Unit A
- 2638 Parker St
- 2601 Benvenue Ave
- 2616 College Ave