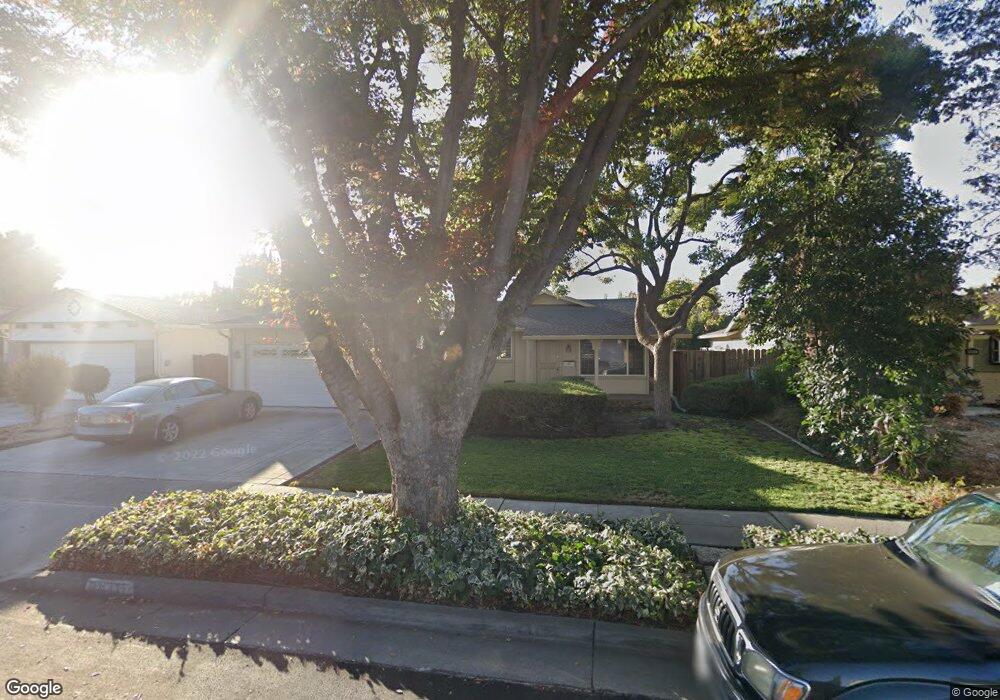
2611 Bon Bon Dr San Jose, CA 95148
Norwood NeighborhoodEstimated Value: $1,336,000 - $1,527,000
3
Beds
2
Baths
1,487
Sq Ft
$934/Sq Ft
Est. Value
About This Home
This home is located at 2611 Bon Bon Dr, San Jose, CA 95148 and is currently estimated at $1,388,407, approximately $933 per square foot. 2611 Bon Bon Dr is a home located in Santa Clara County with nearby schools including Cedar Grove Elementary School, Quimby Oak Middle School, and Mt. Pleasant High School.
Ownership History
Date
Name
Owned For
Owner Type
Purchase Details
Closed on
Sep 14, 2017
Sold by
Udasco Clement T and Messino Laura A
Bought by
Udasco Clement T and Messineo Laura A
Current Estimated Value
Home Financials for this Owner
Home Financials are based on the most recent Mortgage that was taken out on this home.
Original Mortgage
$20,000
Outstanding Balance
$16,701
Interest Rate
3.9%
Mortgage Type
Credit Line Revolving
Estimated Equity
$1,371,706
Purchase Details
Closed on
Aug 22, 1996
Sold by
Udasco Celement T and Messineo Laura A
Bought by
Udasco Clement T and Messineo Laura A
Home Financials for this Owner
Home Financials are based on the most recent Mortgage that was taken out on this home.
Original Mortgage
$175,000
Interest Rate
8.23%
Create a Home Valuation Report for This Property
The Home Valuation Report is an in-depth analysis detailing your home's value as well as a comparison with similar homes in the area
Home Values in the Area
Average Home Value in this Area
Purchase History
| Date | Buyer | Sale Price | Title Company |
|---|---|---|---|
| Udasco Clement T | -- | Chicago Title Company | |
| Udasco Clement T | -- | First American Title Guarant |
Source: Public Records
Mortgage History
| Date | Status | Borrower | Loan Amount |
|---|---|---|---|
| Open | Udasco Clement T | $20,000 | |
| Previous Owner | Udasco Clement T | $175,000 |
Source: Public Records
Tax History Compared to Growth
Tax History
| Year | Tax Paid | Tax Assessment Tax Assessment Total Assessment is a certain percentage of the fair market value that is determined by local assessors to be the total taxable value of land and additions on the property. | Land | Improvement |
|---|---|---|---|---|
| 2025 | $6,124 | $366,123 | $135,261 | $230,862 |
| 2024 | $6,124 | $358,945 | $132,609 | $226,336 |
| 2023 | $5,979 | $351,908 | $130,009 | $221,899 |
| 2022 | $5,943 | $345,009 | $127,460 | $217,549 |
| 2021 | $5,801 | $338,245 | $124,961 | $213,284 |
| 2020 | $5,539 | $334,778 | $123,680 | $211,098 |
| 2019 | $5,386 | $328,214 | $121,255 | $206,959 |
| 2018 | $5,306 | $321,779 | $118,878 | $202,901 |
| 2017 | $5,216 | $315,471 | $116,548 | $198,923 |
| 2016 | $4,973 | $309,286 | $114,263 | $195,023 |
| 2015 | $4,901 | $304,641 | $112,547 | $192,094 |
| 2014 | $4,356 | $298,675 | $110,343 | $188,332 |
Source: Public Records
Map
Nearby Homes
- 2689 Vista Verde Dr
- 2715 Sugarplum Dr
- 2708 Glen Ferguson Cir
- 3286 Dias Dr
- 2666 Hesselbein Way
- 3324 Trebol Ln
- 2467 Flint Ave
- 2805 Gavilan Dr
- 2277 Flint Ave
- 2895 Burdick Way
- 3216 Remington Way
- 2209 Fairmont Dr
- 2896 Rathmann Dr
- 2017 Flintbury Ct
- 2837 Mantis Dr
- 2885 Mantis Dr
- 3144 Coldwater Dr
- 3156 Coldwater Dr
- 2195 Cunningham Ct
- 3514 Milburn St