X
Landlord's Agent in 2023
Xiaoling Shi
Avenue Realty
(408) 249-1008
18 Total Sales
Estimated Value: $1,086,000 - $1,154,662
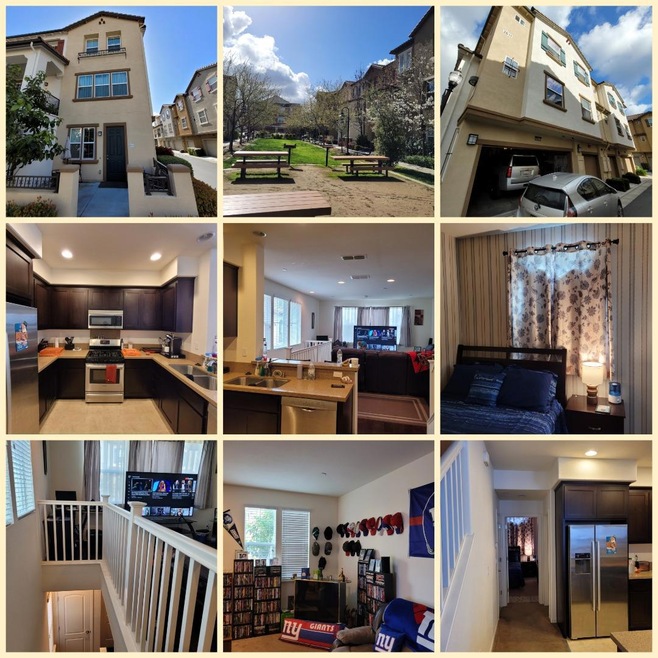
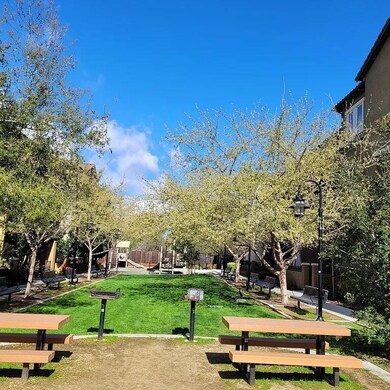
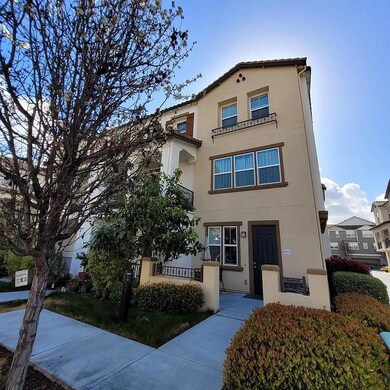
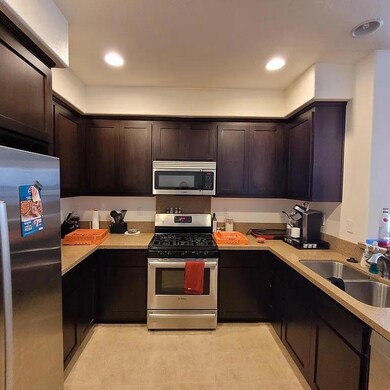
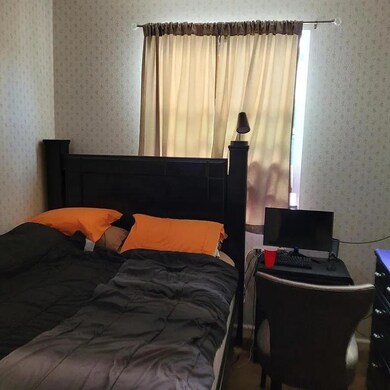
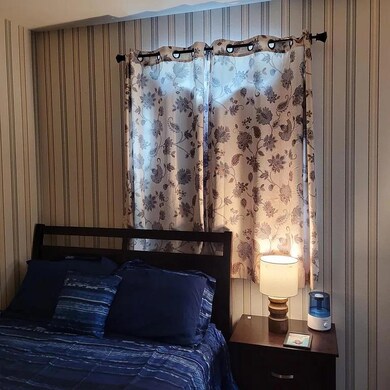
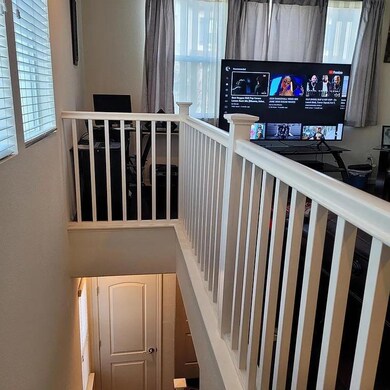
Welcome to this desirable 3 bed/3.5 bath corner unit townhome style condo. Spacious & bright with no neighbors below/above. It has side by side 2-car garage. Each room can have its own bathroom.This 1809 Square footage home was built on 2013, it has a large kitchen with plenty of storage cabinets, 5 burner stove, stainless steel appliance, water softener, full size interior laundry area with washer/dryer. Master suite has dual sink master bath with large walk-in closet. Nice Patio in the front. Once move in, you will get to enjoy the community park and bbq area or walk/drive to the nearby Penitencia Creek & Alum Rock Park; both with amazing recreational trails to explore. Walking distance to VTA station, Target, and grocery stores. Convenient location with easy access to I-680, minutes-drive to Berryessa & Milpitas BART stations, San Jose airport, and Downtown San Jose! This home is a commuters' dream. Hot water /waste removal included. Owner pays for HOA.
Last Renter's Agent
RECIP
Out of Area Office License #00000000
Home Type
Est. Annual Taxes
Year Built
Lot Details
Parking
Interior Spaces
Kitchen
Bedrooms and Bathrooms
Utilities
Community Details
Listing and Financial Details
| Date | Buyer | Sale Price | Title Company |
|---|---|---|---|
| Yang Yibing | $564,000 | Chicago Title Company |
| Date | Status | Borrower | Loan Amount |
|---|---|---|---|
| Closed | Yang Yibing | $220,000 | |
| Previous Owner | Yang Yibing | $250,000 |
| Date | Event | Price | Change | Sq Ft Price |
|---|---|---|---|---|
| 06/09/2023 06/09/23 | Rented | $3,895 | 0.0% | -- |
| 06/06/2023 06/06/23 | Under Contract | -- | -- | -- |
| 04/18/2023 04/18/23 | Price Changed | $3,895 | -1.4% | $2 / Sq Ft |
| 04/08/2023 04/08/23 | For Rent | $3,950 | 0.0% | -- |
| 07/31/2013 07/31/13 | Sold | $563,627 | 0.0% | $312 / Sq Ft |
| 01/15/2013 01/15/13 | Pending | -- | -- | -- |
| 01/15/2013 01/15/13 | For Sale | $563,627 | -- | $312 / Sq Ft |
| Year | Tax Paid | Tax Assessment Tax Assessment Total Assessment is a certain percentage of the fair market value that is determined by local assessors to be the total taxable value of land and additions on the property. | Land | Improvement |
|---|---|---|---|---|
| 2024 | $10,445 | $677,371 | $338,685 | $338,686 |
| 2023 | $10,254 | $664,091 | $332,045 | $332,046 |
| 2022 | $10,192 | $651,071 | $325,535 | $325,536 |
| 2021 | $9,295 | $638,305 | $319,152 | $319,153 |
| 2020 | $9,000 | $631,761 | $315,880 | $315,881 |
| 2019 | $8,569 | $619,375 | $309,687 | $309,688 |
| 2018 | $8,448 | $607,231 | $303,615 | $303,616 |
| 2017 | $8,501 | $595,325 | $297,662 | $297,663 |
| 2016 | $8,148 | $583,653 | $291,826 | $291,827 |
| 2015 | $8,057 | $574,887 | $287,443 | $287,444 |
| 2014 | $7,135 | $563,627 | $281,813 | $281,814 |
X
Landlord's Agent in 2023
Xiaoling Shi
Avenue Realty
(408) 249-1008
18 Total Sales
R
Tenant's Agent in 2023
RECIP
Out of Area Office
A
Seller's Agent in 2013
Ann Marie Olson
Bay East AOR
M
Buyer's Agent in 2013
Mike Liu
Bay East AOR
Source: MLSListings
MLS Number: ML81924034
APN: 254-78-093
Disclaimer: Certain information contained herein is derived from information provided by parties other than Homes.com. All information provided is deemed reliable, but is not guaranteed to be accurate and should be independently verified.
![]() Property Information © 2025 MLSListings Inc. All rights reserved. Listing information is deemed reliable but not guaranteed. Certain information contained herein is derived from information which is the licensed property of, and copyrighted by, MLSListings Inc. The viewer acknowledges ownership and validity of its copyright. Information provided is for personal, non-commercial use by a viewer with a bona fide interest in the purchase or sale of real estate of the type being offered via this website or other electronic means. The viewer is prohibited from copying, redistributing or retransmitting any of the data or information provided by MLSListing, Inc.
Property Information © 2025 MLSListings Inc. All rights reserved. Listing information is deemed reliable but not guaranteed. Certain information contained herein is derived from information which is the licensed property of, and copyrighted by, MLSListings Inc. The viewer acknowledges ownership and validity of its copyright. Information provided is for personal, non-commercial use by a viewer with a bona fide interest in the purchase or sale of real estate of the type being offered via this website or other electronic means. The viewer is prohibited from copying, redistributing or retransmitting any of the data or information provided by MLSListing, Inc.
