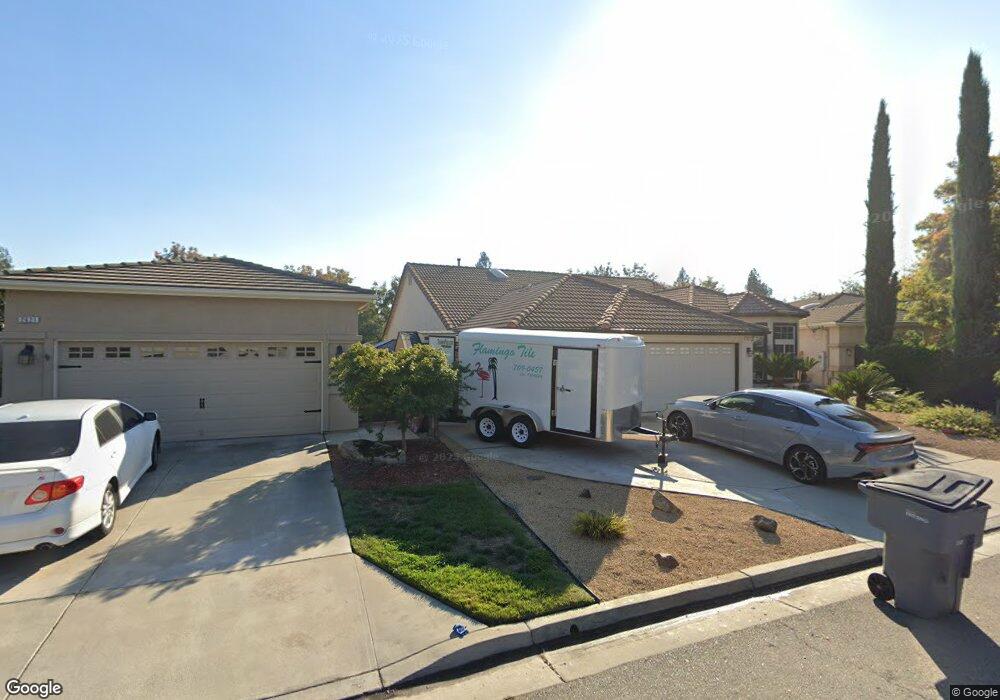
2611 E Eclipse Ave Fresno, CA 93720
Woodward Park NeighborhoodEstimated Value: $469,000 - $679,000
4
Beds
3
Baths
2,269
Sq Ft
$256/Sq Ft
Est. Value
About This Home
This home is located at 2611 E Eclipse Ave, Fresno, CA 93720 and is currently estimated at $579,862, approximately $255 per square foot. 2611 E Eclipse Ave is a home located in Fresno County with nearby schools including Riverview Elementary School, Granite Ridge Intermediate School, and Clovis North High School.
Ownership History
Date
Name
Owned For
Owner Type
Purchase Details
Closed on
Jul 30, 2020
Sold by
Volpa James D
Bought by
Volpa James D
Current Estimated Value
Home Financials for this Owner
Home Financials are based on the most recent Mortgage that was taken out on this home.
Original Mortgage
$145,000
Outstanding Balance
$102,959
Interest Rate
3%
Mortgage Type
New Conventional
Estimated Equity
$476,903
Purchase Details
Closed on
Mar 17, 2015
Sold by
Volpa Leesa M
Bought by
Volpa James D
Home Financials for this Owner
Home Financials are based on the most recent Mortgage that was taken out on this home.
Original Mortgage
$155,000
Interest Rate
3.54%
Mortgage Type
New Conventional
Purchase Details
Closed on
Mar 6, 1998
Sold by
Granville Homes Inc
Bought by
Volpa James D and Volpa Leesa M
Home Financials for this Owner
Home Financials are based on the most recent Mortgage that was taken out on this home.
Original Mortgage
$161,005
Interest Rate
7.01%
Create a Home Valuation Report for This Property
The Home Valuation Report is an in-depth analysis detailing your home's value as well as a comparison with similar homes in the area
Home Values in the Area
Average Home Value in this Area
Purchase History
| Date | Buyer | Sale Price | Title Company |
|---|---|---|---|
| Volpa James D | -- | Placer Title Company | |
| Volpa James D | $90,000 | Placer Title | |
| Volpa James D | $169,500 | Central Title Company |
Source: Public Records
Mortgage History
| Date | Status | Borrower | Loan Amount |
|---|---|---|---|
| Open | Volpa James D | $145,000 | |
| Closed | Volpa James D | $155,000 | |
| Previous Owner | Volpa James D | $161,005 |
Source: Public Records
Tax History
| Year | Tax Paid | Tax Assessment Tax Assessment Total Assessment is a certain percentage of the fair market value that is determined by local assessors to be the total taxable value of land and additions on the property. | Land | Improvement |
|---|---|---|---|---|
| 2025 | $3,610 | $278,053 | $70,537 | $207,516 |
| 2023 | $3,442 | $267,258 | $67,799 | $199,459 |
| 2022 | $3,388 | $262,019 | $66,470 | $195,549 |
| 2021 | $3,291 | $256,882 | $65,167 | $191,715 |
| 2020 | $3,265 | $254,249 | $64,499 | $189,750 |
| 2019 | $3,207 | $249,265 | $63,235 | $186,030 |
| 2018 | $3,103 | $244,379 | $61,996 | $182,383 |
| 2017 | $3,016 | $239,588 | $60,781 | $178,807 |
| 2016 | $2,931 | $234,891 | $59,590 | $175,301 |
| 2015 | $2,910 | $231,363 | $58,695 | $172,668 |
| 2014 | $2,935 | $226,832 | $57,546 | $169,286 |
Source: Public Records
Map
Nearby Homes
- 2602 E Deyoung Dr
- 9540 N Winery Ave
- 9635 N Matus Ave
- 9544 N Larkspur Ave
- 9356 N Jade Ave
- 2857 E Ryan Ln
- 2447 E Okeefe Dr
- 2471 E Okeefe Dr
- 2439 E Okeefe Dr
- 2885 E Ryan Ln
- 9383 N Dearing Ave
- 2582 E Christopher Dr
- 9615 N Willey Ct
- 9680 N Willey Ct
- 2949 E Palisade Dr
- 2293 E Ryan Ave
- 2757 E Jon Dr
- 2887 E Christopher Dr
- 2381 E Christopher Dr
- 2995 E Pryor Dr
- 2621 E Eclipse Ave
- 2601 E Eclipse Ave
- 2631 E Eclipse Ave
- 9525 N Garden Ave
- 2612 E Eclipse Ave
- 9541 N Garden Ave
- 2641 E Eclipse Ave
- 2622 E Eclipse Ave
- 2638 E Deyoung Dr
- 2632 E Eclipse Ave
- 9557 N Garden Ave
- 2626 E Deyoung Dr
- 9502 N Matus Ave
- 2658 E Deyoung Dr
- 9520 N Matus Ave
- 9538 N Matus Ave
- 2614 E Deyoung Dr
- 9573 N Garden Ave
- 2670 E Deyoung Dr
- 2613 E Solar Ave
Your Personal Tour Guide
Ask me questions while you tour the home.