Estimated Value: $179,000 - $211,000
--
Bed
--
Bath
1,036
Sq Ft
$190/Sq Ft
Est. Value
About This Home
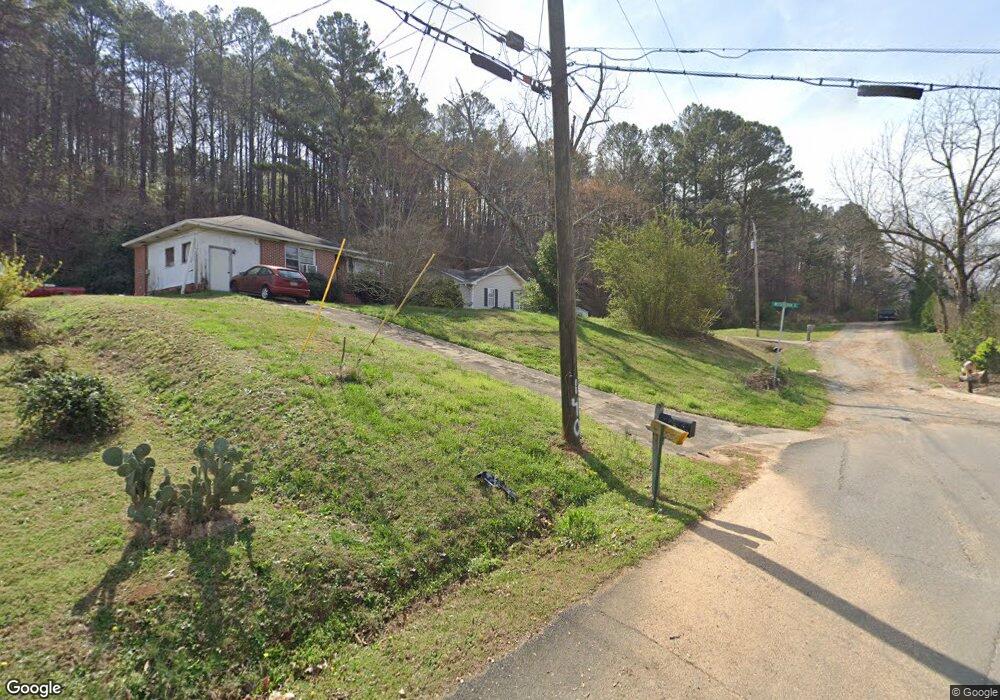
This home is located at 2611 Flannery St SE, Rome, GA 30161 and is currently estimated at $196,981, approximately $190 per square foot. 2611 Flannery St SE is a home located in Floyd County with nearby schools including Pepperell Middle School, Pepperell High School, and Montessori School of Rome.
Ownership History
Date
Name
Owned For
Owner Type
Purchase Details
Closed on
May 15, 2007
Sold by
Not Provided
Bought by
Campbell Gwendal and Carrie Dargin
Current Estimated Value
Home Financials for this Owner
Home Financials are based on the most recent Mortgage that was taken out on this home.
Original Mortgage
$100,621
Outstanding Balance
$61,037
Interest Rate
6.12%
Mortgage Type
FHA
Estimated Equity
$135,944
Purchase Details
Closed on
Jul 9, 2003
Sold by
York Kyle H and Paige Montgomery S
Bought by
Vincent Robert Brandon and Misti Ann
Purchase Details
Closed on
Feb 22, 1999
Sold by
Norman Construction Co Inc
Bought by
York Kyle H and Paige Montgomery S
Purchase Details
Closed on
Apr 2, 1998
Sold by
Clyde Davis Bldrs Inc Clyde Davis Bldrs
Bought by
Norman Construction Co Inc
Purchase Details
Closed on
Sep 1, 1961
Bought by
Clyde Davis Bldrs Inc Clyde Davis Bldrs
Create a Home Valuation Report for This Property
The Home Valuation Report is an in-depth analysis detailing your home's value as well as a comparison with similar homes in the area
Home Values in the Area
Average Home Value in this Area
Purchase History
| Date | Buyer | Sale Price | Title Company |
|---|---|---|---|
| Campbell Gwendal | $102,200 | -- | |
| Vincent Robert Brandon | $89,800 | -- | |
| York Kyle H | $79,900 | -- | |
| Norman Construction Co Inc | $8,900 | -- | |
| Clyde Davis Bldrs Inc Clyde Davis Bldrs | -- | -- |
Source: Public Records
Mortgage History
| Date | Status | Borrower | Loan Amount |
|---|---|---|---|
| Open | Campbell Gwendal | $100,621 |
Source: Public Records
Tax History Compared to Growth
Tax History
| Year | Tax Paid | Tax Assessment Tax Assessment Total Assessment is a certain percentage of the fair market value that is determined by local assessors to be the total taxable value of land and additions on the property. | Land | Improvement |
|---|---|---|---|---|
| 2024 | $1,701 | $76,657 | $8,640 | $68,017 |
| 2023 | $1,683 | $73,746 | $7,680 | $66,066 |
| 2022 | $1,516 | $61,896 | $6,400 | $55,496 |
| 2021 | $1,336 | $50,616 | $6,400 | $44,216 |
| 2020 | $1,281 | $47,024 | $4,800 | $42,224 |
| 2019 | $1,088 | $39,387 | $4,800 | $34,587 |
| 2018 | $1,033 | $37,518 | $4,800 | $32,718 |
| 2017 | $971 | $35,386 | $4,800 | $30,586 |
| 2016 | $1,038 | $37,200 | $4,800 | $32,400 |
| 2015 | $1,088 | $37,600 | $4,800 | $32,800 |
| 2014 | $1,088 | $39,581 | $4,800 | $34,781 |
Source: Public Records
Map
Nearby Homes
- 211 Alfred Ave SE
- 2501 Maple Rd SE
- 2523 Maple Rd SE
- 212 Alfred Ave SE
- 36 Saddle Mountain Rd SE
- 2508 Maple Rd SE
- 107 E Linden St SE
- 226 Flora Ave SE
- 3 Belmont Ct SE
- 2710 Maple Rd SE
- 15 Saddlebrook Dr SE
- 2107 Rockmart Rd SE
- 109 Chateau Dr SE
- 211 Chateau Dr SE
- 105 Chateau Dr SE
- 2812 Maple Rd SE
- 2108 Maple Ave SW
- 0 Martha Berry Hwy Unit 7525627
- 2609 Flannery St SE
- 2607 Flannery St SE
- 18 Wisteria Dr SE
- 2605 Flannery St SE
- 17 Wisteria Dr SE
- 16 Wisteria Dr SE
- 2610 Flannery St SE
- 2603 Flannery St SE
- 13 Wisteria Dr SE
- 14 Wisteria Dr SE
- 16 Azalea St SE
- 14 Azalea St SE
- 11 Wisteria Dr SE
- 100 Azalea St SE
- 113 Pecan St SE
- 12 Wisteria Dr SE
- 10 Azalea St SE
- 111 Pecan St SE
- 9 Wisteria Dr SE
- 109 Pecan St SE