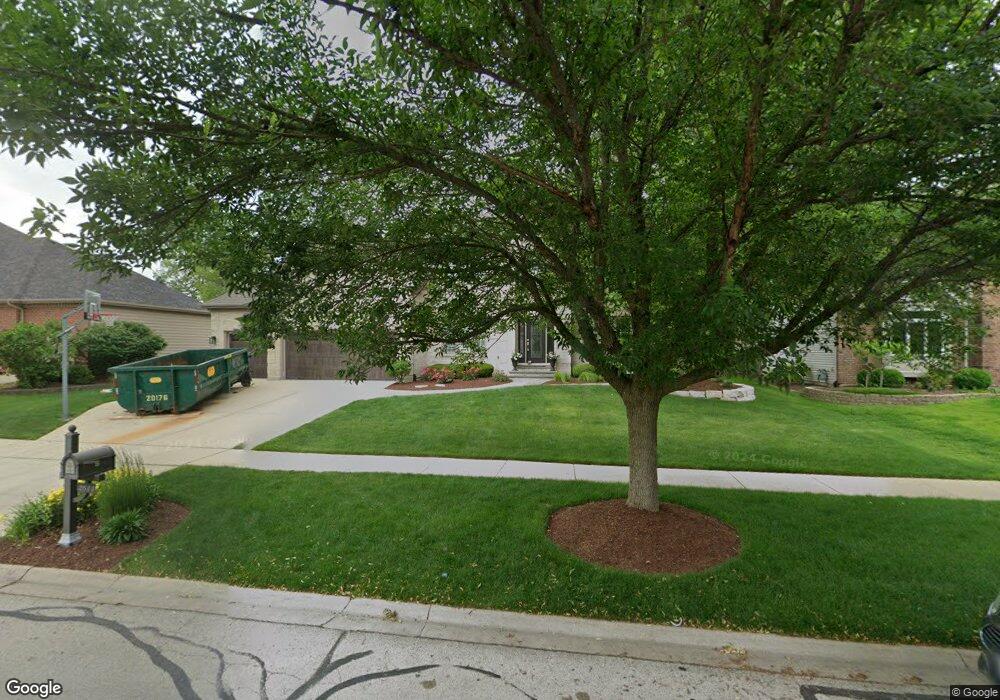
2611 Freeland Cir Unit 4 Naperville, IL 60564
Harmony Grove NeighborhoodEstimated Value: $704,355 - $813,000
--
Bed
1
Bath
2,840
Sq Ft
$270/Sq Ft
Est. Value
About This Home
This home is located at 2611 Freeland Cir Unit 4, Naperville, IL 60564 and is currently estimated at $766,089, approximately $269 per square foot. 2611 Freeland Cir Unit 4 is a home located in Will County with nearby schools including Oliver Julian Kendall Elementary School, Ellsworth Elementary School, and Clifford Crone Middle School.
Ownership History
Date
Name
Owned For
Owner Type
Purchase Details
Closed on
Apr 5, 2023
Sold by
Hargrove James E and Hargrove Margaret
Bought by
Hargrove Revocable Trust
Current Estimated Value
Purchase Details
Closed on
Jan 28, 1998
Sold by
Maf Developments Inc
Bought by
Schillerstrom Homes Inc
Home Financials for this Owner
Home Financials are based on the most recent Mortgage that was taken out on this home.
Original Mortgage
$60,650
Interest Rate
7.08%
Mortgage Type
Construction
Create a Home Valuation Report for This Property
The Home Valuation Report is an in-depth analysis detailing your home's value as well as a comparison with similar homes in the area
Home Values in the Area
Average Home Value in this Area
Purchase History
| Date | Buyer | Sale Price | Title Company |
|---|---|---|---|
| Hargrove Revocable Trust | -- | None Listed On Document | |
| Schillerstrom Homes Inc | $81,000 | Chicago Title Insurance Co |
Source: Public Records
Mortgage History
| Date | Status | Borrower | Loan Amount |
|---|---|---|---|
| Previous Owner | Schillerstrom Homes Inc | $60,650 |
Source: Public Records
Tax History Compared to Growth
Tax History
| Year | Tax Paid | Tax Assessment Tax Assessment Total Assessment is a certain percentage of the fair market value that is determined by local assessors to be the total taxable value of land and additions on the property. | Land | Improvement |
|---|---|---|---|---|
| 2024 | $12,682 | $201,626 | $43,748 | $157,878 |
| 2023 | $12,682 | $178,115 | $38,647 | $139,468 |
| 2022 | $11,403 | $163,384 | $36,560 | $126,824 |
| 2021 | $10,897 | $155,604 | $34,819 | $120,785 |
| 2020 | $10,770 | $153,138 | $34,267 | $118,871 |
| 2019 | $10,506 | $148,822 | $33,301 | $115,521 |
| 2018 | $9,884 | $137,943 | $32,568 | $105,375 |
| 2017 | $11,126 | $152,782 | $31,727 | $121,055 |
| 2016 | $11,106 | $149,493 | $31,044 | $118,449 |
| 2015 | $11,011 | $143,743 | $29,850 | $113,893 |
| 2014 | $11,011 | $139,855 | $29,850 | $110,005 |
| 2013 | $11,011 | $139,855 | $29,850 | $110,005 |
Source: Public Records
Map
Nearby Homes
- 2711 Wait Rd
- 2255 Wendt Cir
- 29W316 Andermann Dr
- 1736 Robert Ln
- 3707 Junebreeze Ln
- 11110 Highland Dr
- 1804 Princess Cir
- 26106 W Sherwood Cir
- 23234 W Allagash Dr
- 24531 W 103rd St
- 24024 W Champion Dr
- 11319 Maplewood Dr
- 3432 Redwing Dr Unit 2
- 3740 Ryder Ct
- 3420 Sunnyside Ct
- 3423 Sunnyside Ct
- 2547 Mallet Ct
- 2543 Mallet Ct
- 2539 Mallet Ct
- 2519 Mallet Ct
- 2615 Freeland Cir
- 2607 Freeland Cir
- 2603 Freeland Cir
- 2619 Freeland Cir
- 10649 Bridle Path Ct
- 10650 Bridle Path Ct
- 2612 Freeland Cir Unit 4
- 2616 Freeland Cir
- 2608 Freeland Cir
- 2620 Freeland Cir
- 2604 Freeland Cir Unit 4
- 2535 Freeland Ct Unit 4
- 2623 Freeland Cir
- 2624 Freeland Cir
- 2611 Hoddam Rd Unit 4
- 2615 Hoddam Rd
- 2607 Hoddam Rd
- 2619 Hoddam Rd Unit 4
- 2628 Freeland Cir
- 2531 Freeland Ct