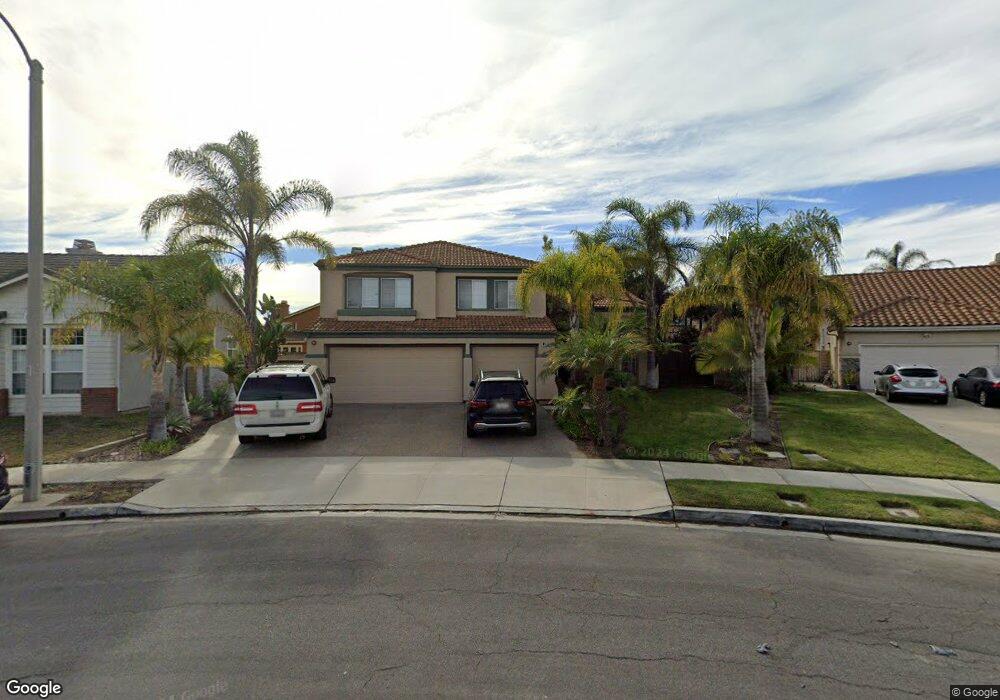
2611 Vista Loop Oxnard, CA 93036
South Bank NeighborhoodEstimated Value: $987,000 - $1,173,000
4
Beds
3
Baths
2,333
Sq Ft
$459/Sq Ft
Est. Value
About This Home
This home is located at 2611 Vista Loop, Oxnard, CA 93036 and is currently estimated at $1,071,102, approximately $459 per square foot. 2611 Vista Loop is a home located in Ventura County with nearby schools including Rio Del Norte Elementary School, Rio Vista Middle School, and Rio Mesa High School.
Ownership History
Date
Name
Owned For
Owner Type
Purchase Details
Closed on
Apr 23, 2004
Sold by
Alshamy Mike
Bought by
Alshamy Mike and Alshamy Nadia
Current Estimated Value
Home Financials for this Owner
Home Financials are based on the most recent Mortgage that was taken out on this home.
Original Mortgage
$333,000
Outstanding Balance
$153,310
Interest Rate
5.35%
Mortgage Type
New Conventional
Estimated Equity
$917,792
Purchase Details
Closed on
Feb 23, 2001
Sold by
Alshamy Nadia
Bought by
Alshamy Mike
Home Financials for this Owner
Home Financials are based on the most recent Mortgage that was taken out on this home.
Original Mortgage
$251,000
Interest Rate
6.98%
Purchase Details
Closed on
Jul 12, 2000
Sold by
Alshamy Mike
Bought by
Alshamy Mike and Alshamy Nadia
Home Financials for this Owner
Home Financials are based on the most recent Mortgage that was taken out on this home.
Original Mortgage
$251,000
Interest Rate
8.55%
Purchase Details
Closed on
Jun 16, 2000
Sold by
Alshamy Nadia
Bought by
Alshamy Mike
Home Financials for this Owner
Home Financials are based on the most recent Mortgage that was taken out on this home.
Original Mortgage
$251,000
Interest Rate
8.55%
Purchase Details
Closed on
Jun 9, 2000
Sold by
Graham Thomas F
Bought by
Alshamy Mike
Home Financials for this Owner
Home Financials are based on the most recent Mortgage that was taken out on this home.
Original Mortgage
$251,000
Interest Rate
8.55%
Purchase Details
Closed on
Dec 15, 1999
Sold by
Gallagher Graham Regina K
Bought by
Graham Thomas F
Home Financials for this Owner
Home Financials are based on the most recent Mortgage that was taken out on this home.
Original Mortgage
$248,000
Interest Rate
7.37%
Create a Home Valuation Report for This Property
The Home Valuation Report is an in-depth analysis detailing your home's value as well as a comparison with similar homes in the area
Home Values in the Area
Average Home Value in this Area
Purchase History
| Date | Buyer | Sale Price | Title Company |
|---|---|---|---|
| Alshamy Mike | -- | Equity Title Company | |
| Alshamy Mike | $125,000 | Fidelity National Title | |
| Alshamy Mike | -- | Fidelity National Title Co | |
| Alshamy Mike | -- | Fidelity National Title | |
| Alshamy Mike | $341,000 | Fidelity National Title | |
| Graham Thomas F | -- | Chicago Title Co |
Source: Public Records
Mortgage History
| Date | Status | Borrower | Loan Amount |
|---|---|---|---|
| Open | Alshamy Mike | $333,000 | |
| Closed | Alshamy Mike | $251,000 | |
| Closed | Alshamy Mike | $251,000 | |
| Previous Owner | Graham Thomas F | $248,000 |
Source: Public Records
Tax History
| Year | Tax Paid | Tax Assessment Tax Assessment Total Assessment is a certain percentage of the fair market value that is determined by local assessors to be the total taxable value of land and additions on the property. | Land | Improvement |
|---|---|---|---|---|
| 2025 | $6,339 | $538,199 | $205,522 | $332,677 |
| 2024 | $6,339 | $527,647 | $201,493 | $326,154 |
| 2023 | $6,080 | $517,301 | $197,542 | $319,759 |
| 2022 | $5,905 | $507,158 | $193,668 | $313,490 |
| 2021 | $6,016 | $497,214 | $189,870 | $307,344 |
| 2020 | $6,140 | $492,118 | $187,924 | $304,194 |
| 2019 | $5,894 | $482,470 | $184,240 | $298,230 |
| 2018 | $5,697 | $473,011 | $180,628 | $292,383 |
| 2017 | $5,547 | $463,737 | $177,087 | $286,650 |
| 2016 | $5,265 | $454,645 | $173,615 | $281,030 |
| 2015 | $5,396 | $447,817 | $171,008 | $276,809 |
| 2014 | $5,166 | $439,047 | $167,659 | $271,388 |
Source: Public Records
Map
Nearby Homes
- 2716 Windcrest Ct
- 2485 Elderberry Dr Unit 43
- 2870 Wagon Wheel Rd Unit 203
- 2820 Wagon Wheel Rd Unit 302
- 2820 Wagon Wheel Rd Unit 403
- 2800 Wagon Wheel Rd Unit 304
- 2810 Wagon Wheel Rd Unit 304
- 2455 Blueberry Dr Unit 120
- 905 Kumquat Place
- 2475 Apple Ln Unit 129
- 2408 Apple Ln Unit 154
- 1340 Kumquat Place
- 901 Indigo Place
- 643 Holly Ave
- 550 Holly Ave
- 2715 Smokey Mountain Dr
- 1361 Gardenia St
- 629 Forest Park Blvd
- 3014 N Oxnard Blvd
- 2151 Olga St
- 2609 Vista Loop
- 2613 Vista Loop
- 2534 Joshua Ct
- 2524 Joshua Ct
- 2544 Joshua Ct
- 2615 Vista Loop
- 2607 Vista Loop
- 2514 Joshua Ct
- 2554 Joshua Ct
- 2610 Vista Loop
- 2716 Windcrest Place
- 2617 Vista Loop
- 2608 Vista Loop
- 2611 Upper Bay Dr
- 2710 Windcrest Place
- 2601 Upper Bay Dr
- 2564 Joshua Ct
- 2720 Windcrest Place
- 2720 Windcrest Ct
- 2606 Vista Loop
Your Personal Tour Guide
Ask me questions while you tour the home.