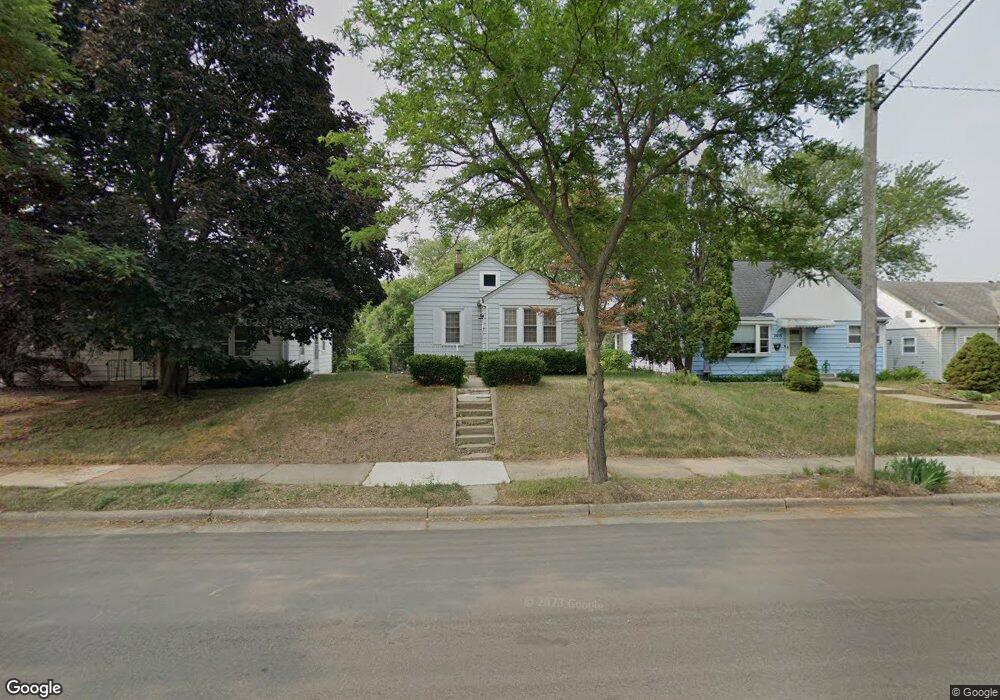
2611 W 60th St Minneapolis, MN 55410
Armatage NeighborhoodEstimated Value: $311,000 - $328,000
2
Beds
2
Baths
1,088
Sq Ft
$295/Sq Ft
Est. Value
About This Home
This home is located at 2611 W 60th St, Minneapolis, MN 55410 and is currently estimated at $321,282, approximately $295 per square foot. 2611 W 60th St is a home located in Hennepin County with nearby schools including Armatage Elementary School, Anthony Middle School, and Southwest Senior High School.
Ownership History
Date
Name
Owned For
Owner Type
Purchase Details
Closed on
Dec 23, 2021
Sold by
Steven Berg
Bought by
Benson Luke A
Current Estimated Value
Home Financials for this Owner
Home Financials are based on the most recent Mortgage that was taken out on this home.
Original Mortgage
$200,000
Outstanding Balance
$183,625
Interest Rate
2.98%
Mortgage Type
New Conventional
Estimated Equity
$137,657
Purchase Details
Closed on
May 26, 2011
Sold by
Sec Of Housing & Urban Development
Bought by
Berg Steven
Purchase Details
Closed on
Feb 3, 2011
Sold by
Chase Home Finance Llc
Bought by
The Secretary Of Hud
Purchase Details
Closed on
Jul 29, 2005
Sold by
Emerick Jeffrey D
Bought by
Oxley Katey G
Purchase Details
Closed on
Aug 16, 1996
Sold by
Ryan Colleen Mar
Bought by
Petrofski Laura Lynn
Create a Home Valuation Report for This Property
The Home Valuation Report is an in-depth analysis detailing your home's value as well as a comparison with similar homes in the area
Home Values in the Area
Average Home Value in this Area
Purchase History
| Date | Buyer | Sale Price | Title Company |
|---|---|---|---|
| Benson Luke A | $270,000 | New Title Company Name | |
| Benson Luke | $270,000 | -- | |
| Berg Steven | $95,000 | -- | |
| The Secretary Of Hud | -- | None Available | |
| Oxley Katey G | $210,000 | -- | |
| Petrofski Laura Lynn | $68,000 | -- |
Source: Public Records
Mortgage History
| Date | Status | Borrower | Loan Amount |
|---|---|---|---|
| Open | Benson Luke | $200,000 | |
| Closed | Benson Luke A | $200,000 |
Source: Public Records
Tax History Compared to Growth
Tax History
| Year | Tax Paid | Tax Assessment Tax Assessment Total Assessment is a certain percentage of the fair market value that is determined by local assessors to be the total taxable value of land and additions on the property. | Land | Improvement |
|---|---|---|---|---|
| 2024 | $4,020 | $275,000 | $164,000 | $111,000 |
| 2023 | $3,749 | $280,000 | $170,000 | $110,000 |
| 2022 | $3,100 | $274,000 | $130,000 | $144,000 |
| 2021 | $2,739 | $238,000 | $87,000 | $151,000 |
| 2020 | $2,966 | $216,500 | $87,800 | $128,700 |
| 2019 | $2,890 | $216,500 | $72,800 | $143,700 |
| 2018 | $2,572 | $206,000 | $72,800 | $133,200 |
| 2017 | $2,373 | $173,000 | $66,200 | $106,800 |
| 2016 | $2,450 | $173,000 | $66,200 | $106,800 |
| 2015 | $2,391 | $163,000 | $66,200 | $96,800 |
| 2014 | -- | $152,500 | $64,900 | $87,600 |
Source: Public Records
Map
Nearby Homes
- 2616 W 60th St
- 6028 Russell Ave S
- 2810 W 60th St
- 6041 Penn Ave S
- 6107 Penn Ave S
- 5921 Xerxes Ave S
- 5818 Xerxes Ave S
- 5728 Vincent Ave S
- 6112 Zenith Ave S
- 6300 Xerxes Ave S Unit 31
- 5913 Abbott Ave S
- 5704 Washburn Ave S
- 5711 Xerxes Ave S
- 5720 Xerxes Ave S
- 6024 Abbott Ave S
- 6400 Vincent Ave S
- 6301 York Ave S Unit 102
- 6309 York Ave S Unit 204
- 6315 York Ave S Unit 201
- 6315 York Ave S Unit 203
- 2615 W 60th St
- 2605 W 60th St
- 2601 W 60th St
- 2617 W 60th St
- 6016 Sheridan Ave S
- 6001 Thomas Ave S
- 6015 Thomas Ave S
- 6020 Sheridan Ave S
- 6019 Thomas Ave S
- 2521 W 60th St
- 6024 Sheridan Ave S
- 2608 W 60th St
- 2612 W 60th St
- 2600 W 60th St
- 6023 Thomas Ave S
- 2620 W 60th St
- 2517 W 60th St
- 2701 W 60th St
- 5949 Thomas Ave S
- 6028 Sheridan Ave S